GIS Increases Awareness
There is a significant shift in how electric utilities use geographic information system (GIS) technology. In the old days and maybe even now, utility staff thought GIS was a system that automates the mapping process. And yes, it could also provide good information to other critical systems, such as outage management systems (OMS) or distribution management systems (DMS). Advanced utilities even used GIS to help in the design and construction of their facilities. That’s all great.
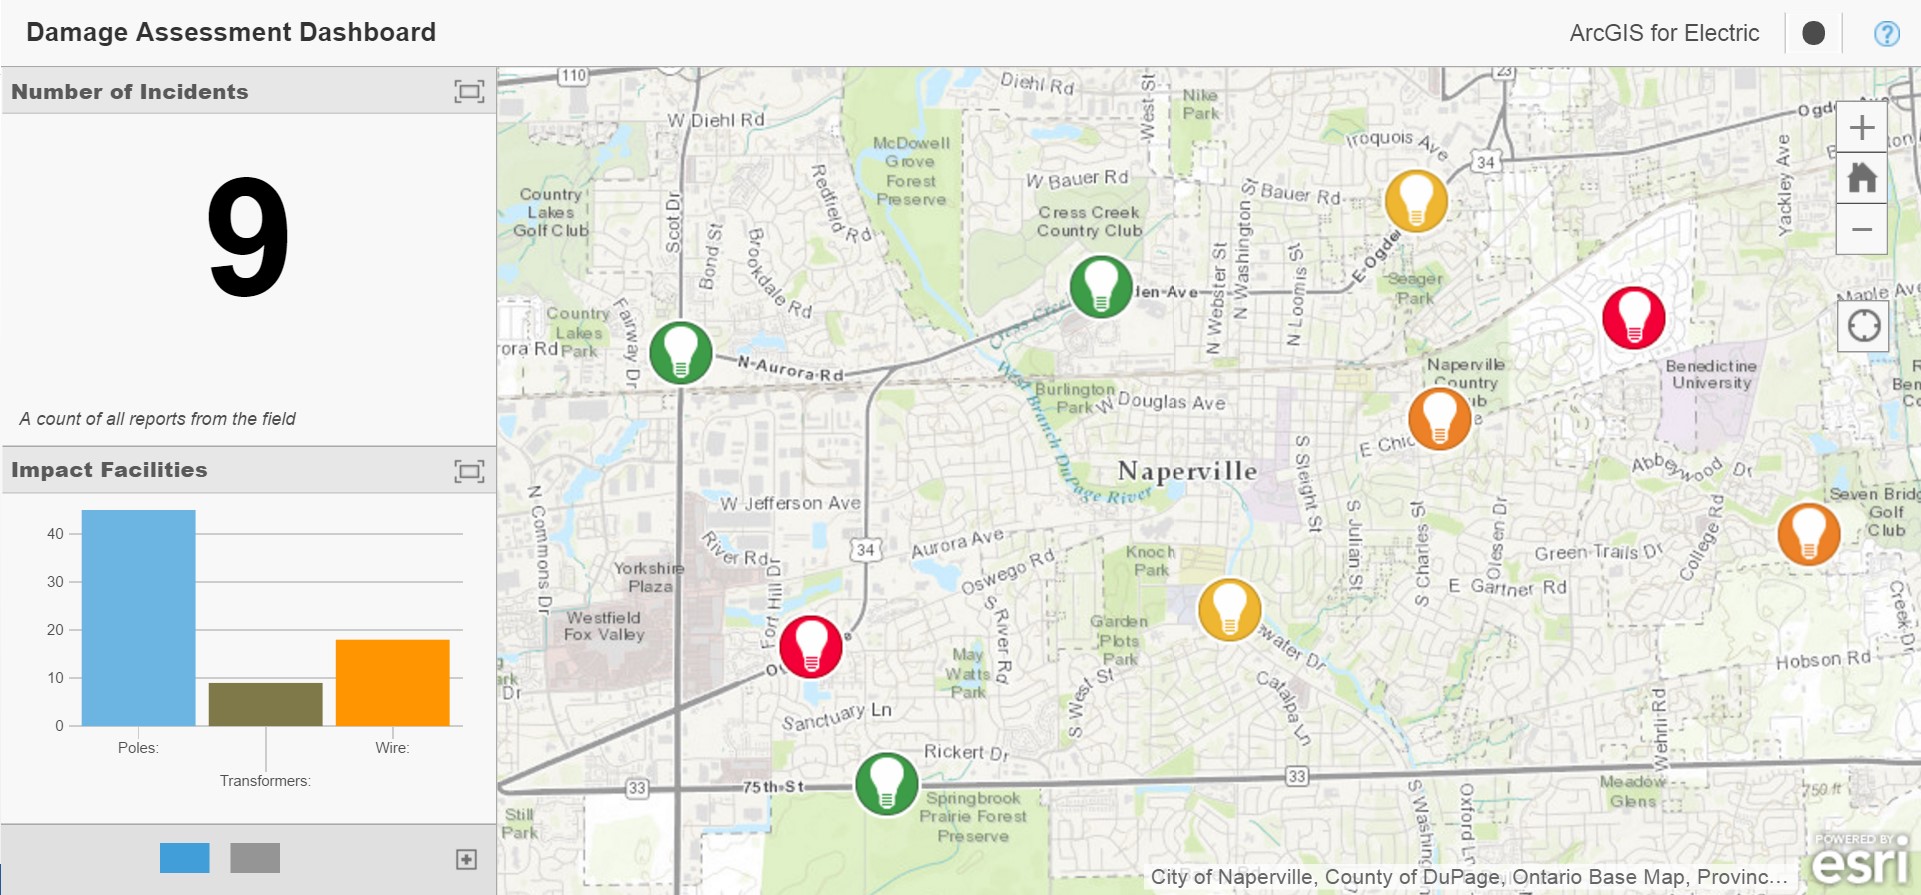
In my last post, I spoke about how Esri’s ArcGIS platform masters three powerful yet simple things—the three As. It provides access—the simple process of serving up all the wonderful data stored in GIS on any device, anytime, and anywhere. So when utility staff update information on their mobile phone, tablet, or smart watch—such as details on a broken pole or a sparking wire—all company staff have access to that information on their devices, at the exact same time, in the form of interactive maps. Take a picture, write a note, record a video, and link it to the map for all to see.
The second A is awareness. Not only can people gain access and update geospatial data for others to use with the ArcGIS platform, they can also gain a better understanding of what’s going on right now—in real time.
Less Information Is Never Better
“More information is always better than less.”—Simon Sinek, author
Sinek would never agree that “less is more.” The author goes on to describe the value of more information. “When people know the reason things are happening, even if it’s bad news, they can adjust their expectations and react accordingly. Keeping people in the dark only serves to stir negative emotions.”
When I worked for a power company, it was my job to make sure people were not in the dark—literally. When people were out of power, we figured out why: A snowstorm drizzled ice onto power lines; or someone had crashed into a utility pole; or a squirrel climbed onto the lines not knowing that its tail could act as a very nice conductor.
Yet when people called the power company, the customer service representatives often kept callers in the dark—figuratively and literally. The reason was, and often still is, because the industry can’t always answer the question, when will my lights be back on?
Why is that? It’s because the utilities themselves don’t have enough information.
The problem isn’t an overall lack of data. Lots of people have lots of information. The problem is that not everyone in the power company has complete awareness of what’s going on in real time. Someone might have a pretty good insight into grid damage. Others might know where the crews are deployed. An entirely different group might know if they have material on hand to fix the issue. Eventually the power company will have the answer. But when the customers call, the utility just doesn’t have the right processes in place to gain complete awareness right away.
In cases of widespread power failure, electric utilities need lots of information—and fast. They have some information. Advanced metering infrastructure (AMI automated meters), for instance, can link to the advanced distribution management system (ADMS) to paint a clear picture of how many customers are out of power and where they are located. However, the utility still can’t answer that simple yet profound question, when will my lights be back on?
It’s All about Awareness
During outage events, power companies have to answer another simple question, what’s going on right now?
To apply Sinek’s philosophy, the more information—about the damage, conditions on the ground, location of hazards and field crews, weather, flooding, downed trees, customers without power—the better. Sinek agrees that the faster the power company gets that information, the better.
Automated vehicle location (AVL) systems tell the utility where all the trucks are at a given time. OMS reports detail about who doesn’t have power and even provide analyses of probable damaged locations. Weather services give forecasts and accurate assessment of weather. Real-time storm gauges provide flood information. Satellite systems deliver real-time imagery. And customers Tweet about the outages faster than Kanye West can type out his latest 140-character Twitter rant.
Making Sense of the Information
The trick to analyzing a lot of information coming in from many sources is to have a common framework to help you figure out what’s going on. You could get a phone call from a taxi driver saying that she heard a loud bang or saw a flash before the lights went out. Or you could have a customer Tweet about a tree hitting a wire line. Or perhaps someone could use a cell phone to photograph a broken pole. The common denominator for all this information is location.
Location could unlock a critical pattern. For instance, what if all these pieces of information were to have the same location? Then the loud bang and flash, the Tweeted tree, and the photo of the broken pole would point to a single event. You would send one crew to fix the problem. If the information speaks to different events, you could still track and dispatch crews for efficient repairs.
The ArcGIS platform merges information from multiple sources that have a location reference. After organizing information by its location components, the ArcGIS platform provides situational awareness—so you always know what is going on and where. And as situations change—floodwaters rise, lightning strikes, tornadoes shift course—GIS consumes that real-time data along with all kinds of authoritative information to give decision makers the right information at the right time. And since GIS provides access (the first A) and the ability to update data, utilities can make rapid assessments of material, crew, and logistic needs. They can figure out how many crews to deploy or declare or call off an emergency. They can communicate accurately to the media, regulators, and first responders.
Through awareness, utilities can eliminate unnecessary steps; avoid wasted trips; focus on fast decision making about customer restoration; warn crews about hazards; and, at the same time, provide outstanding transparency to the community.
Answers = Awareness
Most utilities today deploy GIS, but many limit it to traditional uses. That’s changing. Innovative utilities are figuring out that if they can answer the question (what’s going on right now?) then they can share, communicate, and collaborate faster and more accurately. These utilities are able to provide fieldworkers with critical answers on their mobile devices. And they will have an answer to that question, when will my lights be back on?
Sure Sinek is right—more information is better than less. But it’s not enough to just have more information. Pulling the information into the ArcGIS platform helps utilities connect the dots to answer the other question, what’s going on right now?
That leads to the next step—what to do about it. In my next post, we’ll get into advanced decision making with analytics.
For proven solutions in managing electric operations with GIS, visit esri.com/electric.
insider
