Miami Beach, Florida, which lies on a barrier island a few miles off the coast of Miami, is one of the most vulnerable areas for sea level rise in the United States, if not the world.
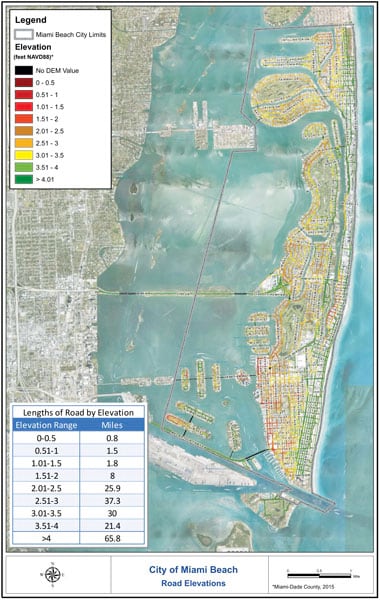
By the end of the century, global mean sea levels could rise by about 11 to 43 inches, according to the United Nations Intergovernmental Panel on Climate Change (IPCC). South Florida is likely to face 17 to 31 inches of sea level rise by 2060, according to projections made last year at the Southeast Florida Climate Leadership Summit. And Miami Beach has a unique, bowl-like geography wherein the center of the island is lower than its beaches to the east and coastal defenses to the west, making it even more prone to flooding.
That’s why the city has been working with Esri partner Jacobs, a technical consulting engineering firm, to find out where its biggest flooding concerns are and determine how to consolidate public works projects to better prepare for sea level rise while minimizing disruptions to residents. Using ArcGIS Pro and ArcGIS Spatial Analyst, the team at Jacobs combined climate change projections with the city’s own infrastructural data—and now, Miami Beach is tackling these projects in a more efficient and effective way.
Flood Management That Works—But There’s More to Do
The city of Miami Beach already experiences unusual flooding. Higher-than-normal tides, called king tides, now flood the streets regularly.
“It could actually be a sunny day, and you’ll see flooding in the streets and have to wade through water to get to your car,” said Matt Alvarez, the Miami-Dade executive manager at Jacobs.
“Adding significant rain events to those high tides causes substantial flooding in the lowest-lying areas of the city,” added Roy Coley, director of the Public Works Department for the City of Miami Beach.
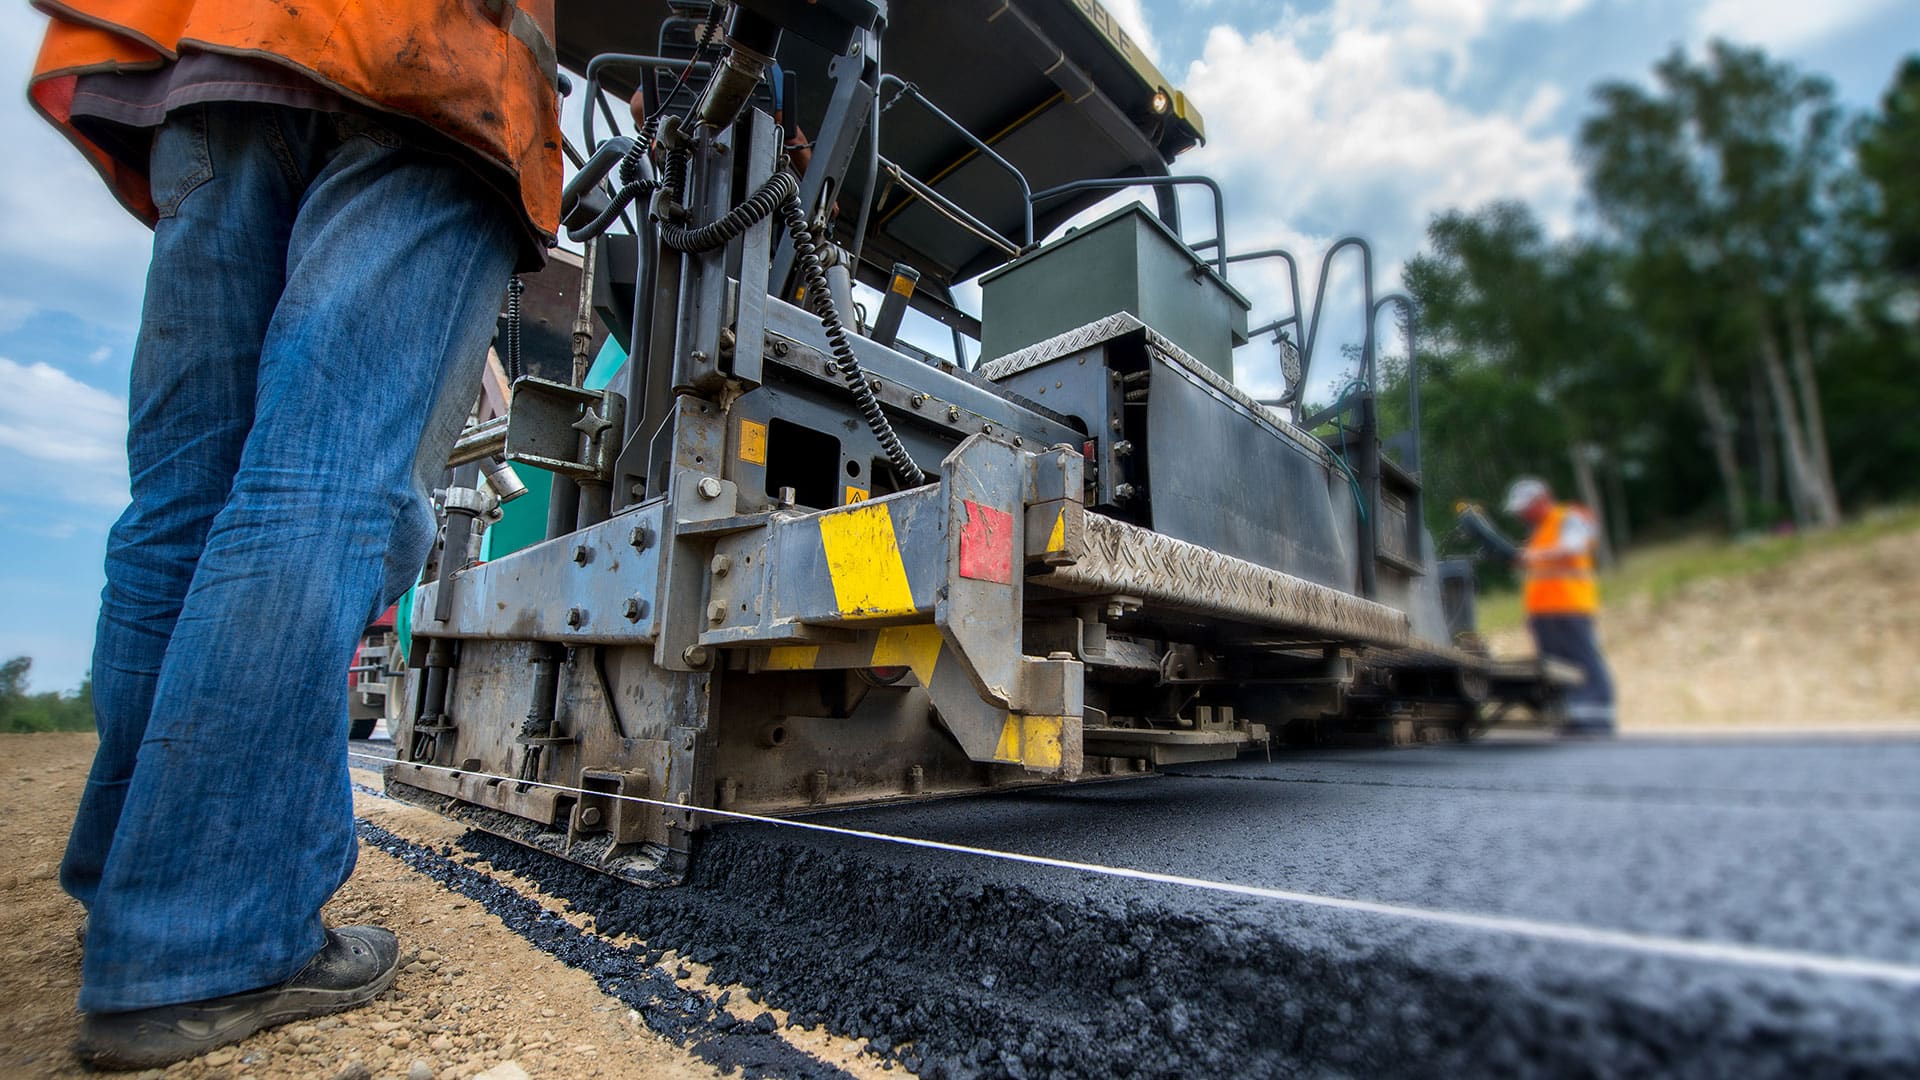
The city began mitigating tidal flooding back in 2013. It implemented a cutting-edge stormwater management plan that took into consideration 30-year forecasts for sea level rise. Miami Beach started elevating its most vulnerable roads and improving its stormwater pumping system.

“We were one of the first cities to actually take bold steps to manage flooding,” said Coley.
But predictions have changed since then, and by 2017, the city’s new mayor, Dan Gelber, wanted to ensure that Miami Beach was on track to actually diminish the effects of sea level rise. Working with the Rockefeller Foundation, the city brought in the Urban Land Institute (ULI) to review the projects and plans it already had under way.
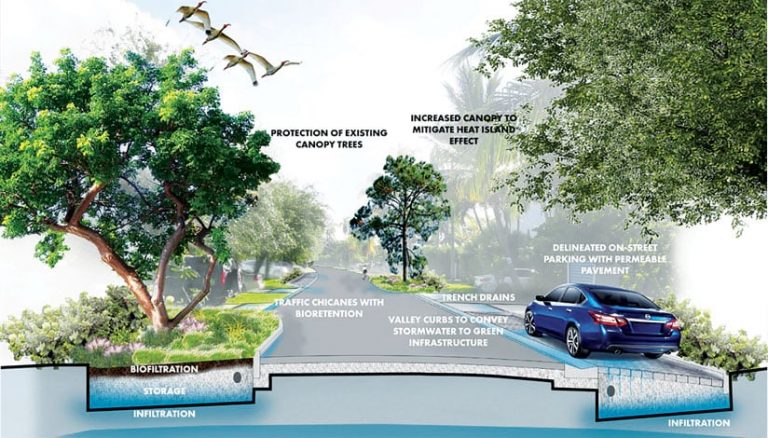
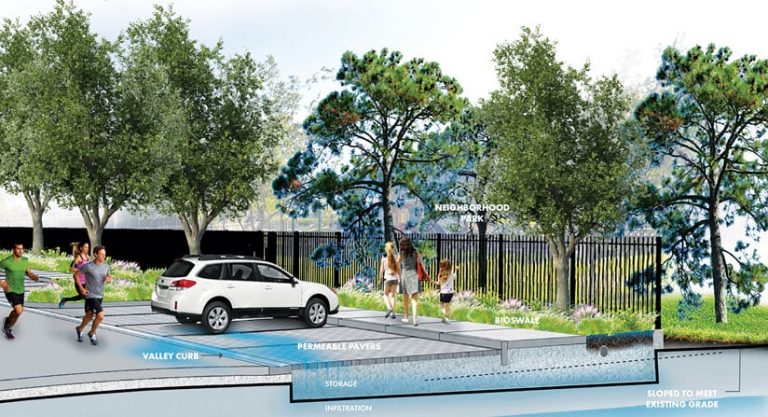
The organization did a comprehensive analysis and concluded that, overall, the city had done many things well. However, there was still room for improvement—especially when it came to implementing blue and green infrastructure (a way of using urban green spaces to manage floodwaters) and ensuring that each project provided multiple benefits to the surrounding neighborhoods.
To put ULI’s recommendations into action, the City of Miami Beach enlisted Jacobs. The team there—which consists of Alvarez; Jason Bird, the company’s Florida resilience lead; hydrologists; planners; and a robust group of GIS experts and spatial analysts—used GIS to visualize all the data.
“It was fundamental for us to map out where things were happening, where the needs were, and how to prioritize the different neighborhood projects,” said Alvarez. “I’m not sure how we would’ve done this project without GIS.”
Taking On Sea level Rise While Minimizing Disruptions
With ArcGIS Pro and the Spatial Analyst extension, the team at Jacobs mapped out Miami Beach’s infrastructural priorities. From there, it determined ways to improve how the city is preparing for sea level rise.
The City of Miami Beach provided extensive amounts of data from its asset and capital management program, which Jacobs combined with its own data on flood risk and city service needs. The project had three aims:
- Figure out how Miami Beach can better incorporate blue and green infrastructure to mimic nature’s water cycles and reduce flood risk. This includes coming up with ways to preserve the island’s freshwater lens, which keeps salty groundwater at bay, to protect trees and infrastructure and support public services and facilities.
- Evaluate the city’s road-raising strategy and ensure that it fits Miami Beach’s evolving needs.
- Examine project size and sequencing so the city can prioritize the most important ones and see if any are too large (and thus take too long) or too small (and don’t provide adequate benefits).

“The city has done a great job identifying tidal flood risk areas that require immediate intervention,” said Bird. “We’ve been able to add additional layers to previous analysis to capture other city needs, such as water, wastewater, stormwater management, and road enhancement projects. By spatially analyzing all those different critical city functions and understanding how they interact with one another, we’ve been able to review city projects and ensure that when a capital project is performed, we can minimize disruptions in the neighborhood.”
“Flood risks, water and sewer needs, and other utility and infrastructure needs have been mapped out, so the city has a plan on where to go in first and so forth,” Alvarez added. “GIS has been a very useful tool for our team to set project and neighborhood priorities across the City of Miami Beach.”
Projects Get Prioritized and Consolidated
After approving Jacobs’s recommended flood adaptation guidance in October 2020, the City of Miami Beach was set to start implementing the suggestions that came out of it—beginning with consolidating road-raising and infrastructure improvement projects in certain high-priority neighborhoods.
“Now, something is no longer just a pump project or a pipeline project,” said Alvarez. “We’ve developed groups of infrastructure projects that provide significant value to the community or neighborhood they’re being implemented in. The groups of projects are very thorough and cover the needs in the area, allowing the city to go in once, do the work, and then have everything be done at the same time.”

One area that Jacobs focused on specifically was helping the city of Miami Beach preserve its freshwater lens.
“As sea levels rise and saltwater pushes up, there’s a layer [lens] of freshwater between the surface of the land and the saltwater,” explained Coley. “If we lose that, our vegetation will go away. But by using blue and green infrastructure, we can constantly replenish that freshwater lens and abate the sea level that’s rising beneath us.”
“Flooding is a nuisance, but that freshwater is a very valuable asset to the city for preserving its freshwater lens and keeping seawater down,” added Alvarez. “In this way, we can convert what is initially a liability for the city and bring it into use.”
Being able to group blue and green infrastructure projects like that together with road-raising and stormwater system improvement plans in areas with the most pressing needs is going to make this work more efficiently and effectively than ever.
For more information, contact Roy Coley, director of public works for the City of Miami Beach or Nelson Perez-Jacome, city engineer at the City of Miami Beach.

