Whether organizing data on the challenges of eradicating communicable diseases or helping utilities and police departments implement enterprise-wide GIS solutions, Esri partners are engaging communities, increasing efficiencies, and giving more people access to geospatial information.
Here is how four Esri partners are working with—and extending—The Science of Where.
Tracking Challenges to Eliminating Malaria

Progress in curtailing malaria has stalled, with the World Health Organization (WHO) reporting a global increase in burden in 2016 for the first time since 2000. Further increases are likely, according to the World Malaria Report released in late November 2017.
The WHO Global Malaria Programme recognized the need for an interactive mapping tool to identify biological threats that may undermine the prevention, diagnosis, and treatment of malaria. Working with Blue Raster, WHO staff members in Geneva outlined their vision for a powerful display and filtering system that could connect users to authoritative databases on malaria vectors and parasites.
With that guidance—plus data, basemaps, and additional subject matter expertise—from WHO, Blue Raster created the Malaria Threats Map, which shows
- Vector insecticide resistance: where some malaria-carrying mosquitoes can survive exposure to the insecticides that are supposed to kill them.
- Parasite gene deletions: areas in which rapid diagnostic tests for malaria tend to produce false negative results—and cause people to not get treated—because malaria parasites are missing the genes that these tests usually target.
- Parasite drug resistance: where malaria parasites are resistant to the antimalarial drugs used to treat patients.
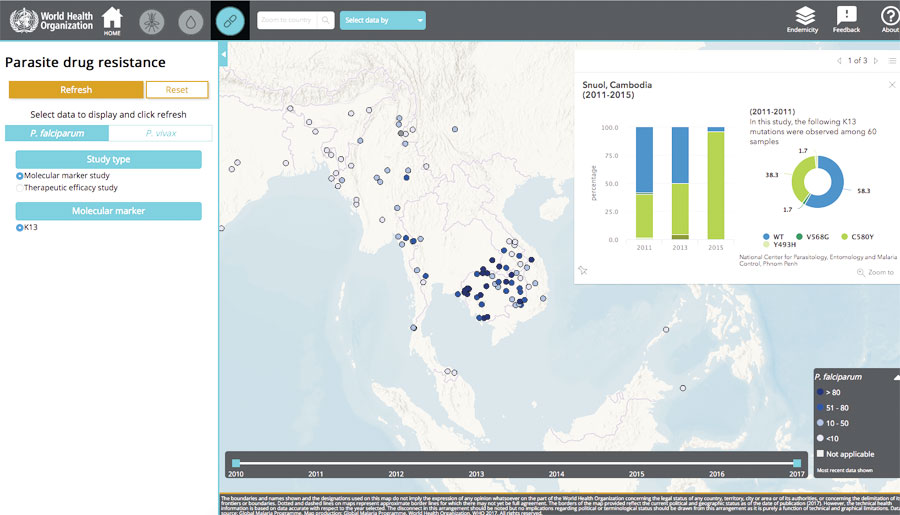
The app provides a visual overview of recent data and gives users the option to display it by geographic area and year, as well as by vector/parasite species, insecticide/drug, study type, and indicator. With all the data stored in ArcGIS Server—and ArcGIS API for JavaScript powerfully rendering it—the story map-like app introduces data via curated narratives, displaying detailed information to users and allowing them to filter through thousands of historic outcomes.
The Malaria Threats Map is the sole consolidated source for linked spatial and analytical data on these three trends, and it is available in English, French, and Spanish. With the development phase of the project completed in 2017, there are plans to implement Phase II—adding more data indicators and functionality—in 2018.
“Blue Raster is honored to work on this global health initiative, bringing the power of GIS to counter a growing malaria threat,” said Blue Raster principal and cofounder Stephen Ansari.
Read more about the app on the WHO website.
Gaining Situational Awareness in Real Time

With a population of 1.5 million and growing, one of the top priorities for the City of Philadelphia is keeping citizens safe. To monitor what’s happening, secure events, and coordinate emergency responses throughout the United States’ sixth-largest city, officials in Philadelphia rely on access to consolidated, real-time data.
The Philadelphia Office of Emergency Management (OEM) collaborated with geographIT, a division of EBA Engineering, Inc., to build a real-time situational awareness platform. Leveraging ArcGIS Online, ArcGIS Server, and ArcGIS GeoEvent Server, the platform—known internally as City View—has a custom-built native mobile tracking app to help locate OEM staff during deployments. The platform also includes an incident management widget, developed with Web AppBuilder for ArcGIS (Developer Edition), that staff members at the emergency operations center (EOC) use to coordinate and monitor responses to both planned events and emergencies. The widget supports creating and updating incident information, communication between OEM and public safety staff, and assigning and tracking the resources deployed to an incident. It streamlines information gathering and incident monitoring, which saves the OEM time when it matters most.
This robust situational awareness platform, complete with interactive web maps and apps, ensures that Philadelphia’s emergency response teams out in the field can view the same real-time information as their colleagues in the EOC. The OEM uses this system 24 hours a day, 7 days a week, 365 days a year to plan, monitor, and manage emergency responses on desktop computers, tablets, and smartphones.
“This solution provides a helpful tool that the OEM uses daily to monitor public safety and security concerns throughout the city,” said Daniel Bradley, director of emergency management for the City of Philadelphia. “It is also an essential tool for planning and coordinating public safety response to large-scale, high-profile events like the 2017 National Football League Draft held in Philadelphia last spring.”
With the system processing millions of data points each day, officials can see constant streams of real-time information that help them monitor and respond to any situation, whether it’s a severe weather event or a parade.
In recognition of this innovative emergency management solution, Esri awarded the City of Philadelphia OEM a Special Achievement in GIS (SAG) Award at the 2017 Esri User Conference.
Keeping Citizens Safe in Fayetteville, North Carolina
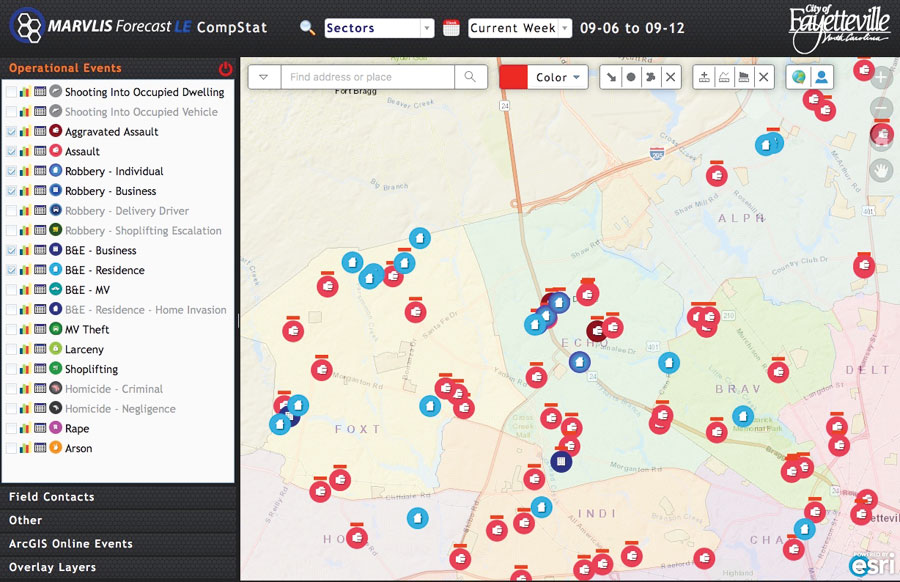
The Fayetteville Police Department understands the benefits of using data-driven solutions to track incidents and enact crime reduction and prevention models for the more than 200,000 citizens in its jurisdiction. But as more facets of police work required accurate and timely data and analytics—from investigations and shift meetings to neighborhood watch programs and public relations initiatives—the burden on the team responsible for data management surged. By 2015, just supporting the administration of weekly departmental CompStat (COMPare STATistics) meetings required 18 hours or more per week from analysts.
Because of its long-standing relationship with the Fayetteville Police Department, the team at Bradshaw Consulting Services understood the challenges the department was facing and how it wanted to improve intelligent data sharing across teams. To meet these needs, Bradshaw Consulting Services (BCS) presented the police department with an opportunity to move to an enterprise system and implement BCS’s MARVLIS Forecast LE solution.
With MARVLIS Forecast LE leveraged on ArcGIS Server via an enterprise agreement, the Fayetteville Police Department can now share data and analytics through portals, dashboards, and widgets. It can also customize and configure these so they meet the specific needs of various staff members, from analysts and command staff to officers in the field. This ensures that critical operations data is freely available throughout the department.
The MARVLIS Forecast LE solution also updates and maintains data sources from various independent databases, such as CAD and record management systems. These data sources supply the various modules of the system, such as the CompStat dashboard, with real-time data like traffic and weather reports.
Since putting MARVLIS Forecast LE and ArcGIS Server into action, the Fayetteville Police Department has experienced an 86 percent reduction in the time it spends curating data and working out internal processes. This gives police officers more time to perform crime analysis and support crime prevention activities—especially since they can now use a series of simple dashboards to complete these assignments. This system has also made it easier for the department to share information through its ArcGIS Open Data site.
Jump-Starting an Enterprise GIS Implementation
 got help with implementation, as well as on-site consulting, from service experts.")
As one of the largest electric utility distribution cooperatives in the United States, Intermountain Rural Electric Association (IREA) in Colorado is responsible for keeping the lights on for more than 150,000 customers over a 5,000-square-mile area. Given the diverse and often extreme weather conditions that characterize this western US state, it is crucial that IREA can continually monitor its vast service area, analyze what’s happening, and act fast as weather changes occur.
To increase access to mission-critical data across teams—both in the office and out in the field—and streamline internal processes, the IREA GIS team connected with SSP Innovations and learned about its Jumpstart for the ArcGIS Utility Network Management extension. With Jumpstart, IREA got help implementing the extension, as well as ArcGIS Pro, along with on-site consulting from SSP Innovations service experts.
Shortly after beginning Jumpstart, IREA recognized that integrating the ArcGIS Utility Network Management extension with its existing business systems offers greater insight and visibility for field crews; new models for managing network data; and the ability to build network diagrams and 3D connectivity, validate that connectivity, and conduct traces in all map presentations. Beyond showing the utility network data model, the Jumpstart lectures discussed the feature and object classes behind the model and offered clear explanations about why the data model was designed the way it was.
The IREA GIS team gained a clear understanding of how Esri visualizes and manages its data within the ArcGIS Utility Network Management extension and how to incorporate the solution into its workflows.
“The most important results attained from our Jumpstart experience [are that we understand] the new data model and the opportunity to provide feedback on the transformation of Utility Network,” said IREA director of GIS Duane Holt. “Working with SSP on Jumpstart allowed IREA to gain this understanding in the most efficient and effective manner possible.”
Esri’s global partners provide customer-focused, geoenabled solutions that span dozens of industries. Products and services range from configured apps and custom-built solutions to complete ArcGIS system implementations and content. Search and discover partners, solutions, and services that meet your needs.