ArcGIS Online Helps World Vision
When Typhoon Haiyan made landfall in November 2013, it did so as the strongest storm ever recorded. The category 5 supertyphoon made its way across the central Philippines, bringing violent winds, torrential rain, and tidal surges that inundated coastal areas.

In its wake, the storm left more than 6,200 people dead. Four million people were displaced by the storm, two million of whom saw their homes completely obliterated. Roads, ports, and airports were also severely damaged by the storm, further complicating efforts to assist the millions of people impacted by the typhoon.
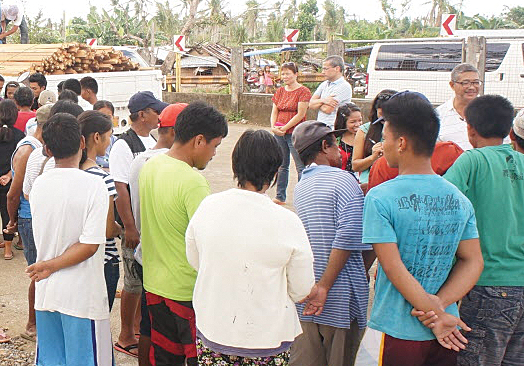
World Vision, an international Christian humanitarian organization dedicated to working with children, families, and their communities, immediately mobilized its response and recovery efforts after the storm. The nonprofit, established in 1950, has a long history of providing emergency assistance to people affected by natural disasters, especially in developing nations with significant vulnerable populations.
World Vision first explored the use of GIS for disaster response following the magnitude 7.0 earthquake that struck Haiti in 2010. Working in tandem with Esri, World Vision tracked the cholera outbreak that spread among refugee camps. The use of GIS left such a strong impression that the organization signed an enterprise-level license agreement with Esri soon afterward. Using the lessons learned from its efforts in Haiti, World Vision’s Humanitarian & Emergency Affairs (HEA) team once again turned to GIS to guide its Typhoon Haiyan response.
Clarity Among the Chaos
As World Vision deployed global relief experts to assist its staff in the Philippines, GIS manager Jared Hyneman and GIS specialist Gabby Almon served as support staff from one of the organization’s offices in Los Angeles. Their first task was to help Sean Ng, World Vision’s information manager in the Philippines, assess locations in the country that needed immediate attention.
Using government data about the scope and intensity of damage from the storm and the preexisting vulnerability of local residents, World Vision’s team created an assessment spreadsheet that assigned a weighted score to each municipality in the Philippines.

“Our response personnel in the Philippines were trying to build up their teams and understand what was going on at the same time,” says Almon. “Mapping the vulnerability scores with ArcGIS Online ended up being key to helping them allocate limited resources.”
Almon and Hyneman joined the vulnerability data from the spreadsheet with administrative boundaries from the United Nations in ArcGIS. They then published the information as a feature service to World Vision’s ArcGIS Online for Organizations account.
Hyneman and Almon decided to use ArcGIS Online to disseminate the maps for several reasons. The interface was easier to navigate than a desktop platform, and the maps could be easily shared over the Internet to anyone with the proper credentials. ArcGIS Online also provided the ability to quickly add in data and information from other authoritative sources.
“We pulled in several services from Esri’s Disaster Response Program, including the typhoon’s path, initial damage assessments, and the locations of hospitals and schools,” Almon says. “Using this existing, authoritative data saved us an incredible amount of time and let us focus on our response.”
Making a Difference
“The web map helped us define the need and really operationalized the vulnerability data,” Ng says. “It just made things so much easier to understand and to create a plan.”
To date, in response to the typhoon, World Vision estimates that it has helped more than 713,000 people. Among the relief operations are kits containing hygiene products, like toothbrushes and soap, as well as tarps, rope, and other construction materials.
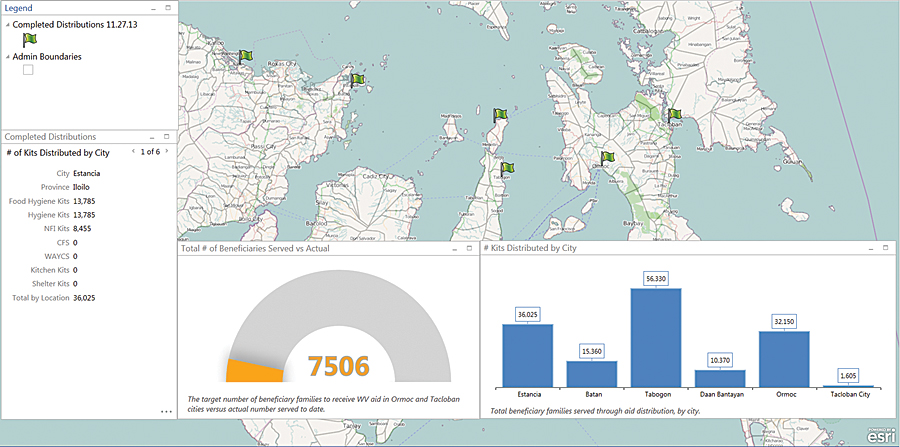
As aid packages were distributed to more than 500 villages across 48 municipalities in the country, Almon and Hyneman used ArcGIS Online to track the progress of their efforts. They created a sample app using Operations Dashboard for ArcGIS that mapped where kits had been sent and monitored their progress against the organization’s overall response goals.
A More Resilient Future
The efforts of Almon and Hyneman generated interest among some of World Vision’s leadership. The nonprofit had already used GIS to support a variety of activities, including providing clean water, education, emergency food relief, and operational logistics. But the Haiyan response has prompted the organization to consider additional, more coordinated uses of GIS in the future.
For more information, contact Jared Hyneman, GIS manager, World Vision, and Gabby Almon, GIS specialist, World Vision.
