
Social Media Content Fuels Big Data Analytics for Esri and IBM
Opinionated consumers, take heart. Your Tweets are being read by people very important to you—the manufacturers of the products you buy. An exciting experiment recently pooled the knowledge of many disciplines to analyze your opinions buried in big data from the Twitterverse. Twitter content is now being mined and is used in analytics methodologies developed by Esri, IBM, and various stakeholders in the big data struggle. Recently, that collaboration kicked off a new era of research that combines Esri technology with IBM’s linguistic and psychological analytics to decode virtual galaxies of information.
Mapping Social Media
We’re bursting at the proverbial seams with data. Never have more IT gurus agreed so widely that data obesity is the biggest threat to human progress if we don’t gain control of it soon. Taming big data requires the invention of new techniques to better understand the monster through analytics and visualization.
For years, social media has provided a rich source of data in Esri maps. In 2011, Esri launched the Japanese earthquake map—a proof-of-concept map that contained Twitter feed data composed of millions of Tweets from Japan. Tweets following the 9.0 Honshu earthquake helped reveal where resources were needed in the crisis. Since then, it has become commonplace to enrich maps with this social media content. Last year, Esri officially entered the big data space by integrating big data workflows into ArcGIS and launching a number of open-source projects on GitHub, including GIS Tools for Hadoop, that infuse big data with geospatial capabilities.
Monitoring Brand
Social media’s high volume, variety, velocity, and veracity meet the defining four characteristics of big data. With more than 500 million Tweets and 3.5 billion “Likes” a day, social media is a perfect example of an extremely large and noisy data source. Within all that chatter, Twitter users share various opinions about their tastes. Filtered from the noise, those opinionated Tweets become a potential window into the buyer mind.

In collaboration with IBM Research Almaden’s Accelerated Discovery Lab—a state-of-the-art facility for researching big data analytics across a variety of industries and domains—Esri built an interactive proof-of-concept map called the Social Monitor that uses Tweets and geospatial technology to understand customer sentiment and focus brand management.
“Just like GIS, big data analysis starts by asking the right questions,” says Jack Dangermond, Esri president. “Through analytics, we extract the answers to help organizations know their customers better. The joint Esri/IBM Social Monitor demonstration combines GIS with the latest research in that area.”
Decoding the Decahose
That Tweets are rich with consumer sentiment would explain why Twitter commoditized its daily user output back in 2010. Since then, Twitter has been licensing its Tweet streams so that companies and their consultants can pan gold from them. To begin its social media analysis, IBM licensed a Decahose of Twitter content (10 percent of daily Tweets) from a third-party reseller.
Could all that customer sentiment be monitored in a brand management tool for, say, clothing retailers? Equipped with the tools to analyze Tweets through multiple lenses, researchers at the Accelerated Discovery Lab plunged into an inaugural project to answer that intriguing question. For the Social Monitor demonstration jointly built with Esri, eight nationwide clothing retailers were chosen to be represented during March 2013.
To build the Social Monitor demonstration, an Esri developer visited the lab for a day to work side by side with the IBM researchers. All software, data, and expertise were available for his use. Using Portal for ArcGIS and ArcGIS for Server, Esri produced an interactive map application that visualized Twitter user data by location and time. This helped the lab identify patterns in the Tweets and provided insights about demographics and consumer type. IBM’s social media analytics decoded sentiment, location, and psycholinguistic attributes to gauge retailer image according to region. Summary information about Tweeters not included in Tweets, including gender and personality traits, is all inferred by the Accelerated Discovery Lab’s algorithms and is displayed on the bottom of the map. Participating brands can be selected on the pull-down menu, making it easy to compare Tweet mentions and customer characteristics between different retailers. For an even more granular perspective, the results of the lab’s psychological analysis runs concurrently with demographics data from Esri Tapestry data. Being able to tease out data on an individual level that considers the intrinsic traits of buyers gives brand managers an extremely powerful customer relations management tool.

Scope of a Crisis
It was a week that felt like forever to one clothing retailer included in the Social Monitor experiment. Last year, the company was barraged with complaints about a defect in a signature line of clothing.
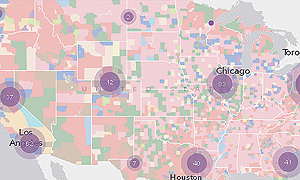
Predictably, Tweet activity mentioning the brand increased in certain areas of the United States, the locations of which are represented on the map in the Social Monitor. Displaying those Tweets geographically revealed consumer reaction to the defect by region, demonstrating the power of social media analytics to deliver real-time information for more immediate brand management.
“GIS can help identify the scope of a problem,” says Mary Roth, research staff member and data integration expert at the Accelerated Discovery Lab. “Coupled with our analytics, Esri can quickly determine where the flurries of Tweets are coming from. If it’s just from Rhode Island, for instance, the geoprocessed data will show that the problem is local rather than national. That information ultimately saves cost in response.”
The Social Monitor demonstration is a simple and effective way of displaying analysis results extracted from Twitter feeds. Once this information is understood, brand managers can drill deeper into the data by studying Tweeters’ personalities and demographics. Data displayed in the map is provided without compromising user privacy and gives companies a more thorough understanding of their customer bases. With that knowledge, they can tailor brand image and respond to negative situations faster and with more focus.
Big Data Analytics for Everyone
Although intimidating, the data deluge opens new opportunities for research not possible before with old, piecemeal analytics. The Social Monitor is just the tip of the iceberg in the quest for better data science. Esri and IBM are currently devising new methods for big data analytics that combine geographic analysis with methodologies born from collaborative research and development. This year, Esri will reveal innovative new tools and methodologies for studying big data as it expands further into this space.
For more information, contact Mary Roth, research staff member, IBM, and Marwa Mabrouk, Esri.