Florida Department of Transportation Uses ArcGIS Server Log Files to Monitor, Improve GIS Usage
At District Five of the Florida Department of Transportation (FDOT), which manages transportation systems in Orlando and other surrounding cities, GIS coordinator Joe Duncan and GIS program services manager Steve Smith wanted to get a better idea of how GIS was being utilized within the organization. Using historical and real-time analytics, they wanted to see which departments were accessing certain data, what services and layers were most used, which apps were making the data requests, and what the daily GIS use looked like.
Tangible metrics like these can inform the allocation of GIS program funds and guide maintenance cycles for data and apps. They can also identify stakeholders that, on one hand, consistently employ GIS or, on the other hand, have not yet experienced its direct benefits.
With ArcGIS for Server (known as ArcGIS Enterprise starting at 10.5), the log files—which record every event that occurs on a server—have all the data needed to perform these analyses. Which is why, when District Five contacted Esri partner VHB to help build a solution, the consulting firm opted for a hybrid system that works directly with the log files while providing a full array of detailed metrics in a user-friendly way.
Building the Hybrid System
From the outset, the project had five goals:
- Identify seasonal peaks for various kinds of data
- Discern users who are not taking advantage of the established GIS program and educate them about its benefits
- Nurture and improve collaboration with active users
- Identify life cycles for apps and data based on usage statistics to support budget planning and schedule data maintenance
- Demonstrate the tangible impacts of GIS for FDOT
To be able to analyze all this, VHB wanted to develop an easy-to-use custom app that allowed FDOT to see quantitatively how services, apps, and layers were being used throughout District Five. This new app—called the Analytics Viewing Application (AVA)—would read the log files from the ArcGIS Server Manager and the Internet Information Services (IIS) for Windows Server (which is what FDOT uses to host its apps) to generate relevant and specialized reports from inside FDOT’s firewall, keeping compliant with the department’s data privacy policies.
VHB used HTML5, JavaScript, Bootstrap, and SQL database tables to build the new hybrid system, as these technologies were readily available and already in use at District Five. To add complexity to the analytics extracted from the log files, VHB relied on a multiphased process. In each of the three phases, VHB incorporated a new, focused component into the app’s analytics and reporting capabilities, such as representing the number of hits a service layer received during a specific time frame or adding metrics to AVA’s different components. Additionally, the development team identified high-value information—such as users, layer visualization, and requesting apps—and extracted that from existing fields in the ArcGIS Server Manager.
To further understand individual code entries and the source data used to create the app, the development team consulted ArcGIS for Server documentation, Esri documentation for log files, the GIS development community, the ArcGIS for Developers community, and GeoNet. Within a year, VHB and FDOT’s District Five refined AVA into a user-friendly app that could visualize GIS usage statistics all the way down to the layer level.
Evaluating How GIS Is Used
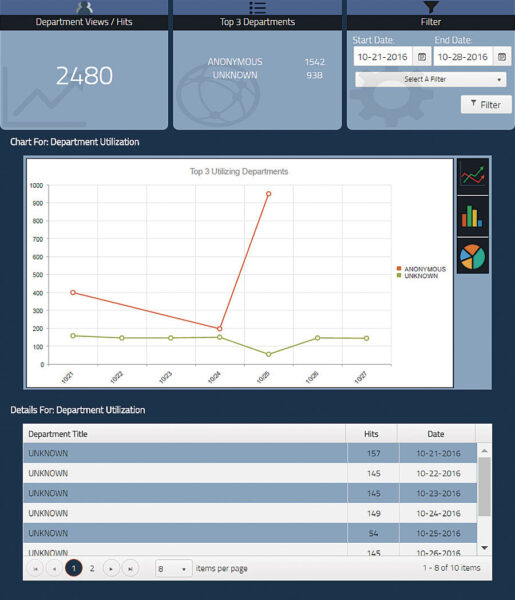
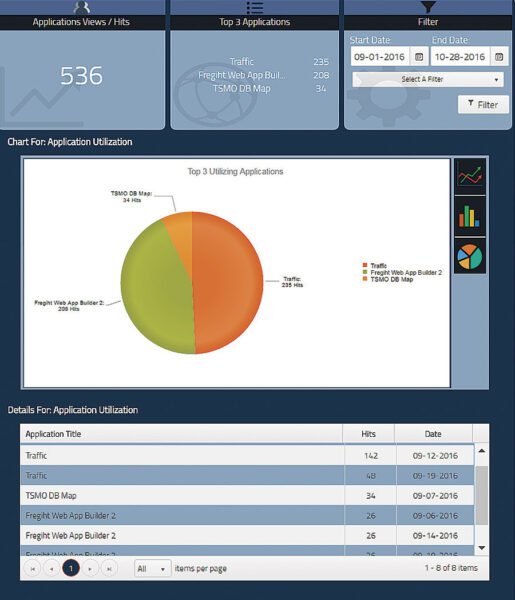
AVA, which works with ArcGIS 10.2 for Server and up (including ArcGIS Enterprise), contains four different views: Department, Application, Service, and Layer. Each view cross-references the others, enabling users to comprehensively visualize relationships between each of the reported variables.
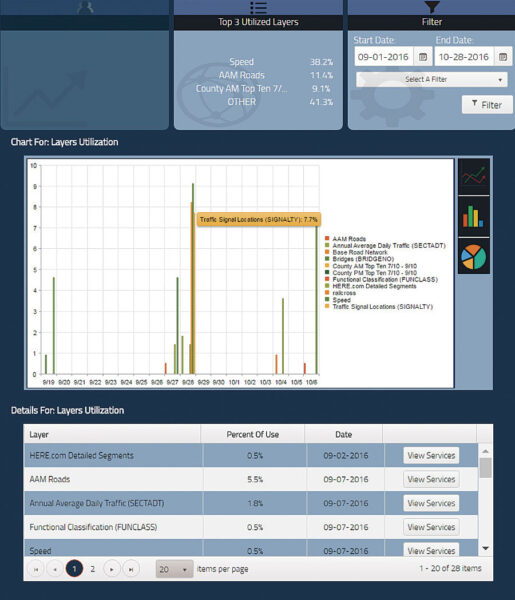
Users can make queries according to a range of dates or specific data categories (department, application, service, or layer). For each of the categories, AVA presents the query results as general counts (for the number of users in a department, as well as the amount of app and service requests) and percentage of use (for layers). Users can also see the top three analytics representing the components of each data category that are engaged with the most.
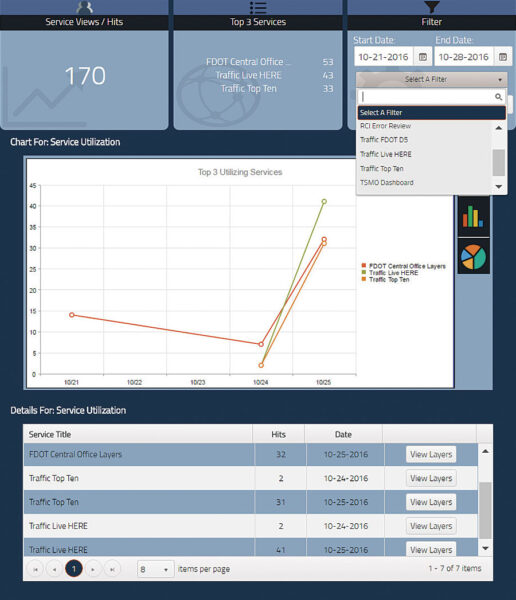
The metrics are easy to read and interact with, viewable as clean and nontechnical tables and charts. This way, project managers and decision-makers at FDOT can understand the usage rates of apps, services, and data and gain more knowledge about the department’s GIS users.
“It’s important to know who your customers are and what information is being utilized,” said Smith. “Knowing [which] departments are using the system the most allows us to focus our training and outreach efforts in the right place. Also, having statistics on the data being used gives us the opportunity to weed out the old and only support what is being used.”
From each perspective, here’s how AVA provides in-depth analysis of GIS usage at FDOT:
- Department View: Department View shows how each cost center within FDOT uses GIS resources. This can be helpful in identifying which departments are the most extensive users of certain feature classes, datasets, or apps. It can also highlight which departments are lagging in use and need more outreach about GIS. A GIS coordinator could employ this view to determine which apps and data need to be configured in a highly available manner. He or she could also use the Department View to better understand demand for certain types of data and figure out whether particular apps and data are used heavily at specific times of the year to help put together data maintenance schedules.
- Application View: This view, which utilizes the IIS logs, allows AVA users to identify which apps and URLs are being requested most or least frequently. It also employs analytics to track usage statistics for individual apps. For example, Duncan can use this metric to determine if an app is seasonal or whether an underused app should be upgraded, redesigned, or phased out. The Application View also sheds light on demand for certain kinds of data and can inform data and app maintenance cycles as well.
- Service View: Service View provides direct access to the GIS services in ArcGIS Server that are being turned on within an app. This metric can help GIS coordinators and managers identify GIS services that are in high demand so they can be evaluated for caching opportunities to make them easier and quicker to use. Service View also delivers a detailed list of which layers belong to which services, helping to identify data that should be refreshed and republished during regular data maintenance cycles.
- Layer View: The greatest level of detail in AVA is provided in the Layer View, which lets Duncan and Smith see how often specific data and layers are employed in comparison to others. This view also helps identify the services a layer belongs to, which can be beneficial when evaluating maintenance and recycling options during conventional data maintenance cycles. Additionally, by providing an easy-to-access list of all layers and services published within a GIS program, duplicate names that refer to different data can be easily spotted. The Layer View demonstrates how important it is to have comprehensive GIS program standards in place, especially regarding naming conventions.
With these analytics from AVA, Duncan and Smith can evaluate exactly how GIS is being wielded throughout District Five. The metrics help them gauge how important certain apps, services, and layers are to specific departments, guiding efforts to streamline and improve FDOT’s overall use of the technology. These details also reveal which cost centers are the greatest users of GIS and which ones need a little more education and coaxing, so the district can channel its GIS funding to the most relevant areas.
Prioritizing Everyday Decisions
With the metrics available on AVA, FDOT leadership now has a tangible record of how valuable GIS is to the organization. Decision-makers at District Five can easily see how each department uses GIS, as well as which types of data and services are used most or least at certain times of the year.
Having data hot spots like this enables Duncan and Smith to prioritize everyday decisions.
“AVA is a tool that [helps] us maximize our resources, focus our energy in the right place, and allows us to utilize our GIS to its fullest extent,” said Smith.
Organizations that are not taking advantage of the log files that are built into ArcGIS are missing out on a great deal of business intelligence that can inform how to build, maintain, and expand a GIS program. Considering that each GIS program is unique—with distinct departments, different GIS implementations, and particular ways of bringing GIS into play—the solutions offered through VHB’s AVA are inexhaustible.
About the Authors
Keith Smith, GISP, is a GIS lead at VHB. Claudia Paskauskas, GISP, PMP, MCSD, SSGB, was (at the time of writing) the southeast technology development manager at VHB. For more information, contact Smith.
