In August 2014, the 6.0 magnitude South Napa Earthquake rocked the City of Napa, California, crumbling historic brick buildings, damaging houses, and causing widespread water leaks. The most powerful earthquake in California since the Loma Prieta earthquake in 1989, it hit this city of 77,000 in the early morning hours of Sunday, August 24, 2014, and caused significant damage in the neighboring communities of Sonoma and Vallejo.

City staff had to quickly assess the damage so response efforts by the city and other agencies could be coordinated. In addition, the public and media were clamoring for information about the extent of the damage and the status of response activities.
The City of Napa had used GIS for a number of years in several city departments. Staff expertise was primarily in desktop GIS use. Although the city had entered into an enterprise license agreement (ELA) several years earlier that came with an ArcGIS Online subscription, the city had not used it.
The city’s GIS coordinator, Katy Wallis, had been in this position less than a year. Previously, she held a GIS analyst position with the County of Napa. Since her arrival, she had been working to move the city’s workflow from one that was CAD- and shapefile-based to a more modern, robust enterprise system based on the ArcGIS platform. Although the city had recently signed a contract with Esri partner Cartegraph systems to implement its Work Order and Asset Management system, the company’s inventorying of the city’s infrastructure would not begin until 2015.
The Tools to Respond
Wallis needed to make information in the city’s GIS available to city staff and other agencies to help coordinate response and recovery efforts as well as keep the public and media informed. To make that happen as rapidly as possible, she reached out to the Esri Disaster Response Program (DRP) for assistance.
DRP is available whenever and wherever disasters occur to provide expert assistance, remote support, software, data, and information products as part of Esri’s corporate citizenship. When a major disaster occurs, DRP immediately begins generating data layers and information products that can support agencies responding to that event.
Wallis soon learned from Esri that the city already had the tools and infrastructure it needed to respond effectively and work collaboratively with other agencies, thanks to the ArcGIS Online subscription that was part of its ELA. By August 26, Wallis set up a private ArcGIS Online Group so the city could share geospatial data and information on emergency operations with other agencies.
Working with DRP, Wallis stood up a web map app in a very short time that answered the immediate needs of the public and media for information on the earthquake. The Napa Earthquake Information map, created using the Public Information map template, was live on August 26 and provided the most urgently requested information—the locations of severely damaged, red-tagged buildings.
Over the next day, information on additional red-tagged buildings and moderately damaged, yellow-tagged buildings was added. To prevent residents who were cleaning up their properties from hauling rubble to nearby school yards and other nondesignated locations, debris dumping site locations were also added to the map.
The earthquake caused numerous ruptures to the city’s water distribution system. Residents needed current information on the status of the water leaks. Color-coded symbols indicating where leaks had been identified and if they had been repaired were also added to the map.
The Napa Earthquake Information map became the go-to resource for current information about the earthquake. It was shown live on KRON Channel 4 and was embedded in numerous newspapers and television station websites. By the end of the first day and a half it was available, the web app received 150,000 hits while using only 0.2 ArcGIS Online account credits.
“This map was the one-click stop for the public to find up-to-date information on damaged buildings, water main leaks, debris drop-off points, and damage to public infrastructure,” said Wallis.
Coordination across Agencies
Other agencies responding to the South Napa Earthquake included the County of Napa, the California Governor’s Office of Emergency Services (Cal OES), the Federal Emergency Management Agency (FEMA), and the American Red Cross. These agencies needed to coordinate their efforts with those of the City of Napa.
Cal OES made extensive and effective use of ArcGIS Online to provide situational awareness to agency executives and the response team in the State Operation Center (SOC) during its five-day activation. The state agency worked with local, state, and federal entities, determining the needs of affected communities and ensuring relief resources were available.
Immediately after the earthquake, Cal OES created situational awareness maps using its traditional workflows to produce paper maps for daily SOC and executive briefings using ArcMap. These maps incorporated data gleaned from the agency’s Situation Status Report.
Chi Smith was a new GIS analyst who had been working at Cal OES for nine months when the South Napa Earthquake hit. She reported to the activation on the second day to meet Esri DRP team member Jon Pedder. Smith and Pedder immediately collaborated on a Story Map Journal. He had previously introduced the app to the agency’s GIS unit, and Smith had immediately introduced it to the Cal OES planning and intelligence chief of SOC, the chief information officer, and Dan Bout, currently the assistant director of response.
Subsequently, Smith and Pedder collaborated with Wallis at the City of Napa and Pedder’s Esri DRP counterpart, Justin Fan, on incident data sharing and product development.
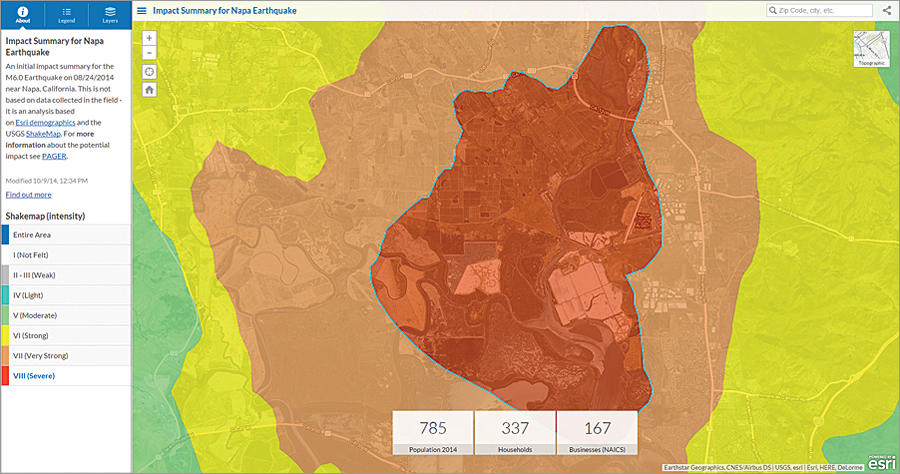
DRP staff used ArcGIS Online GeoEnrichment service with the Impact Summary map template to create a map that showed the population and number of households and businesses in the affected area to the team at the SOC.
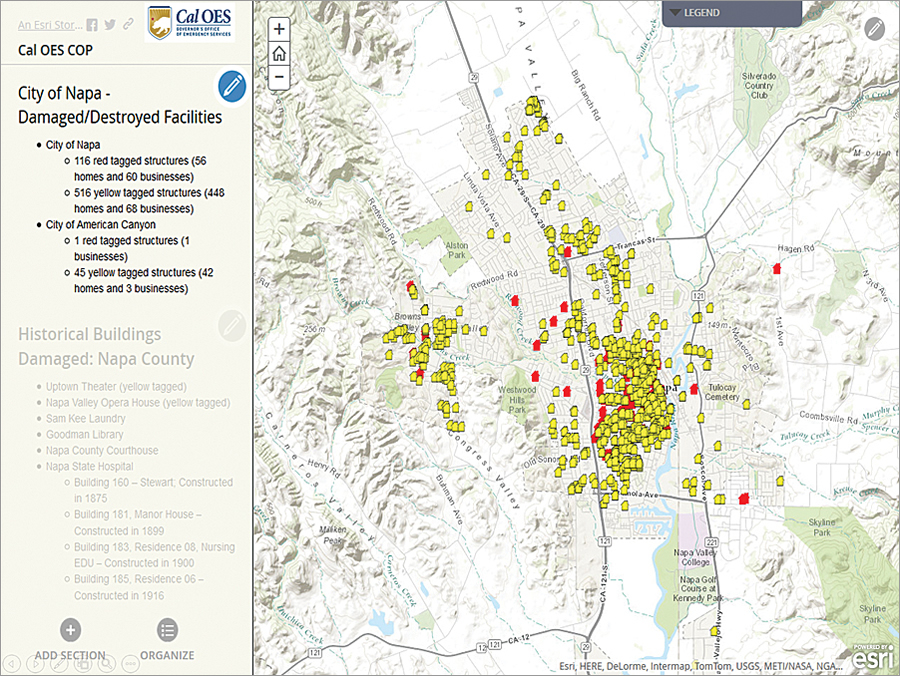
Using data that Cal OES published, DRP produced an Esri Map Journal Story Map about the agency’s response that Cal OES executives adopted as its common operating picture (COP). The locations of damaged and destroyed facilities, geolocated and mapped by Cal OES, were added to this story map as well as damaged historical buildings. The Story Map Journal app provided a geospatial context to information that was disseminated during the twice-daily executive briefings.
An ArcGIS map presentation is a collection of slides that show different views of a map along with pop-ups and titles. Cal OES used a map presentation to coordinate tactical, operational, and strategic planning activities with emergency management agencies and nonprofits involved in the South Napa Earthquake response.
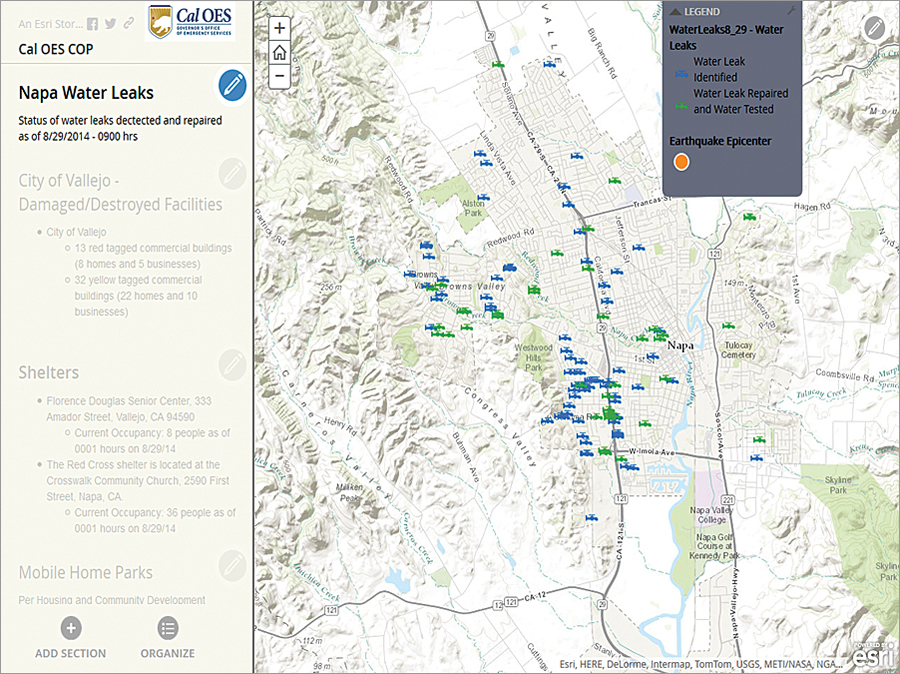
The City of Napa shared its constantly updated authoritative data on water leak locations and the status of repairs via the ArcGIS Online Group. This data was incorporated into the Story Map Journal so Cal OES executives and SOC staff could quickly access it for planning purposes. The locations of damaged facilities in the City of Vallejo, available shelters, the damage sustained by mobile home parks in the surrounding area, the status of nearby medical and health care facilities, and water stations opened in response to concerns over bacterial levels in drinking water were also incorporated.
As efforts moved from response to recovery, the Napa Earthquake Information Sharing Group was formed so the City of Napa could disseminate its information on debris drop-off sites, water leaks, and more detailed damage assessments with Cal OES and Red Cross GIS users.
Valuable Lessons
The City of Napa and Cal OES demonstrated that ArcGIS Online can be a powerful tool for emergency response. Wallis now recommends that cities have the ArcGIS Online emergency response web app preconfigured in advance of that looming and inevitable disaster.
The city rapidly created and released the Napa Earthquake Information map. It went viral because it satisfied the demand for current information on the effects of the earthquake and response efforts being mounted in a geographically referenced context.
Even after immediate response efforts, Wallis found the Napa Earthquake Information map invaluable in communicating the extent of the damage and its impact on the city to state and federal relief agencies. At FEMA’s request, she supplied the map to help FEMA better evaluate the situation. A week after providing the map, both state and federal agencies’ assistance was granted to city residents.
Organizations that are responsible for emergency response should plan ahead to take advantage of the ArcGIS platform to aid their own response and coordinate with other agencies. Familiarizing staff members with tools, such as Collector for ArcGIS, can mean significant time savings and greater accuracy when performing damage assessments immediately after a disaster.
Smith observed that using ArcGIS Online templates enabled quick, safe, and secure data sharing using ArcGIS Online Groups so that state agencies, nonprofits, and businesses could collaborate and share disaster response or recovery information in a timely manner as data is collected or as part of a regular update process. Web apps available from ArcGIS Online helped communicate situational awareness effectively and promptly to both executives and response staff.
“Upon reviewing the workflow and applications used during this activation, Cal OES concluded that the Story Map Journal, map presentation, and the collaboration of online community groups have satisfied the reporting of disaster response activities in a timely and unprecedented manner to the SOC response team and executives,” said Smith. “Consequently, this workflow has been adopted as our standard operating procedure and COP for future earthquakes. Furthermore, it is being implemented as a model for all subsequent disasters.”
Smith noted that having to geocode incident data during the response effort was inefficient as compared with consuming geospatial data made available through an ArcGIS Online Group. She highlighted the importance of establishing an ArcGIS Online community for sharing incident data between government agencies before disasters occur. Smith invites members of the GIS community to join the Cal OES ArcGIS Online Group by sending an email to chi.smith@caloes.ca.gov.
About the author