“People the world over are feeling, or will soon feel, the effects of the strongest El Niño event since 1997–98,” announced climate scientists at NASA’s Jet Propulsion Laboratory in December 2015.
The last El Niño of comparable strength was responsible for ice storms in the northeast; New England, and Canada; tornados in Florida; and widespread flooding and landslides in portions of California that caused 35 counties to be declared federal disaster areas.
A recurring phenomenon, El Niño events happen when sea surface temperatures in the equatorial Pacific Ocean rise, influencing air and moisture movement across the earth and often causing above-average precipitation.
The spring issue of ArcUser in 1998 featured an article describing how GIS analysts at Vandenberg Air Force Base in California used ArcInfo, ArcView GIS, and ArcView 3D Analyst with the HEC RAS hydraulic modeling package to identify which base facilities would be impacted by flooding and landslides and model measures to minimize these impacts. Their analysis not only saved infrastructure but also preserved important habitat.
Organizations dealing with the 2015 El Niño event have many more GIS tools for responding to its effects. These effects of major flooding extend beyond the immediate preservation of people and property to other sectors of the economy, from agriculture to retail.
For example, a GIS framework can minimize disruptions to the supply chain by providing a centralized source of accurate information for efficiently coordinating shipments and rerouting them as necessary. With this overview, managers can control changes in response to conditions and track assets. The GIS that is now furnishing the information infrastructure for many organizations so they can address potential disruptions.
To handle the immediate demands of disasters, governments and other organizations have expanded the use of GIS to support the entire emergency management cycle from risk assessment and planning to mitigation and preparedness. In the intervening 18 years since the last major El Niño event, Esri software has expanded beyond desktop analysis to a platform that includes server, cloud, and mobile.
Analysis now benefits from the big data tools in the ArcGIS platform and its integration with R (the R Project for Statistical Computing). Data sharing between agencies enabled by ArcGIS Online, Esri’s cloud-based solution, and ArcGIS Open Data have vastly increased the information that can be considered in addition to the incorporation of real-time data from sensors, such as rain gages.
Two decades ago, the results of GIS analysis were disseminated through paper and static online maps. While these maps could be rapidly produced, they were dependent on the update cycle and could not provide the most current information. Because they lacked interactivity, these maps—generated to answer one set of questions—could not be queried to answer new questions spawned by response situations in constant flux or address additional scenarios when working on planning, mitigation, or preparedness efforts.
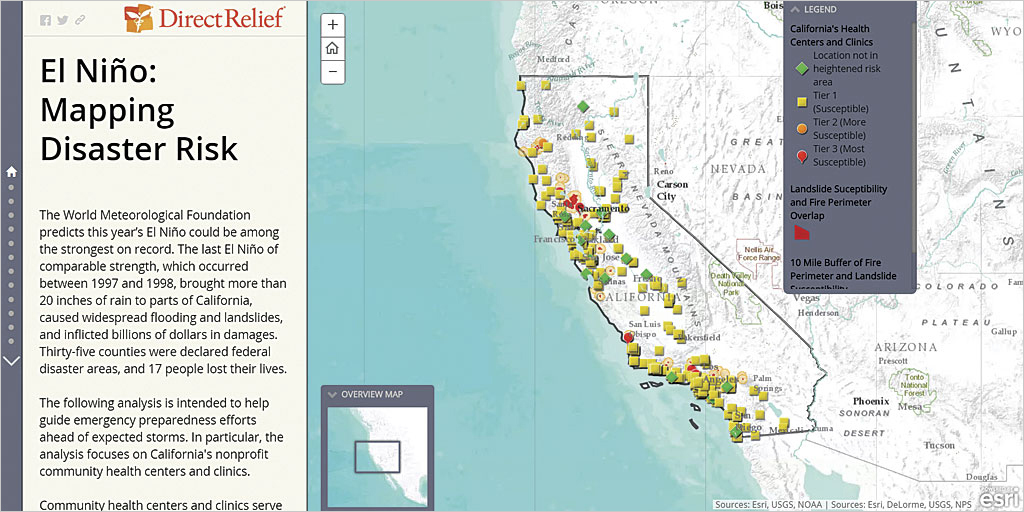
ArcGIS Online answers the need for interactivity, immediate updates, easy collaboration, and rapid dissemination of information to other agencies and the public. Organizations are also using Esri Story Map apps for communicating, whether it is potential risks or the current state of response efforts. DirectRelief, a worldwide humanitarian organization, has used this approach for keeping the public apprised of El Niño hazards. It created a story map communicating the health risks of California’s most vulnerable populations and sharing its analyses evaluating the contributions of drought and recent wildfires to the state’s peril.
Situational awareness is the key to effective emergency management, and again, ArcGIS Online supports greatly enhanced communication during a disaster. The easily configured Operations Dashboard for ArcGIS app provides a real-time common operating picture (COP) for monitoring rapidly changing events, allocating resources in response, and maintaining an overview of the situation. The dashboard works with GIS tools for fieldwork, such as Collector for ArcGIS, so that responders can communicate conditions immediately to emergency managers and everyone else responding to the event.
These same GIS-based communication tools aid activities immediately after an event to assist victims, speed relief, and limit secondary damage. The existing GIS infrastructure at many utilities aids short-term recovery by supporting the restoration of the systems that supply water, food, sanitation, and power.
The longer-term task of rebuilding a community that may take months or years can be guided by geodesign. This strategy for designing more livable communities makes extensive use of GIS tools to model and test alternative designs. This approach can help planners create resilent communities that better withstand extreme weather conditions and other challenges likely to result from climate change.
In response to the immediate threat of flooding from El Niño conditions, Esri recently developed ArcGIS for Flood. This suite of configurable apps, software, and professional services helps communities safeguard people and property and integrate a geographic dimension into emergency planning, response, and recovery activities associated with responding to the flooding.
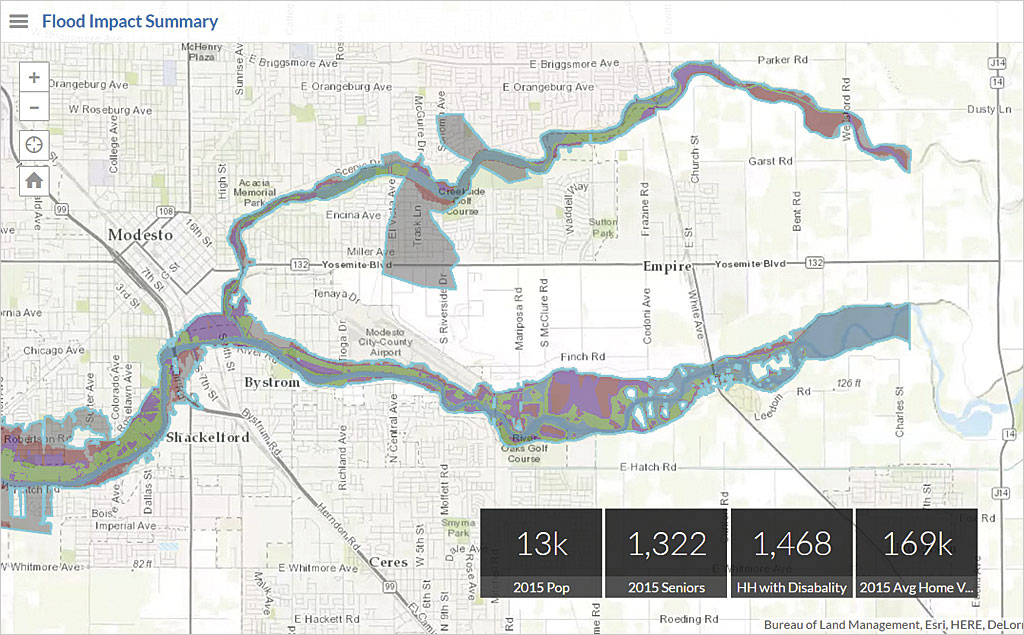
ArcGIS for Flood addresses the entire disaster management cycle from the creation of authoritative flood extents to tools for identifying at-risk assets and populations to communicating evacuation and shelter information to the public. It helps communities minimize the effects of floods and speed recovery. Get more information about ArcGIS for Flood.