Technical Talk
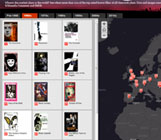 How did a writer turn into a geo-geek? Robby Deming from Esri shows how he of little GIS experience created The Geography of Horror application using Esri ArcGIS Online and the Storytelling Shortlist template.
See how he did it.
-
Rev up to start building new map-based apps! Register today for the Esri Developer Summit, March 10-13, 2014, in Palm Springs, California.
-
Want to use HTML5 and JavaScript in ArcGIS? Join Esri for an online seminar on January 23, 2014, to learn how.
-
Overwhelmed with having to maintain far too many fields in attribute tables? Help is here!
-
Paul Trevillion from Esri defines a GIS service and demonstrates how to create one. Watch this technical workshop.
-
Need logistical solutions? ArcGIS Network Analyst extension saves time, lowers labor and fuel costs, and improves customer service. Watch the technical workshop.
-
A Python tool was recently developed to walk people through the process of creating a ring map. Read the tutorial and get the sample data to make one.
Et cetera
-
Watch what’s happening this minute at 43 US national parks and monuments using The National Parks—Live Esri Story Map embedded with web cams.
-
Learn to create, visualize, and share information about your customers, competitors, and market opportunities by taking this new course, Market Analysis with Esri Business Analyst.
-
The World Topographic Map just got better, with updates for Kuwait, Switzerland, the United Kingdom, Liechtenstein, and Tulsa, Oklahoma. Read the blog.
-
Go back 150 years and follow the course of the three-day Battle of Gettysburg using this Esri story map. See how geography played a role in the rout of Confederate soldiers by the Union Army. Read the blog.
-
Get a free trial to ArcGIS 10.2 for Desktop with 10 extensions, including ArcGIS 3D Analyst, ArcGIS Network Analyst, and ArcGIS Geostatistical Analyst.
-
-
Endpoints
-
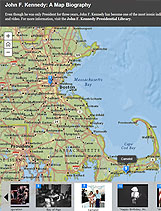
This Esri story map looks back at the life and death of President John F. Kennedy. The map includes embedded videos of Marilyn Monroe singing Happy Birthday Mr, President, and Kennedy’s Ich Bin Ein Berliner speech. And watch a video that shows a 3D GIS reconstruction of Kennedy’s assassination.
-
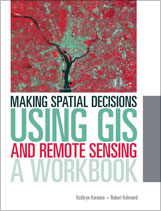
Teach your students the value of image analysis to solve problems with Making Spatial Decisions Using GIS and Remote Sensing. ArcGIS, Landsat imagery, and data are used with the exercises to explore key remote sensing concepts. Take a look.

-
Esri offers ArcGIS for Server pre-installed on Cutting Edge servers available on both Windows and Linux. Optional database servers pre-loaded with Microsoft SQL or PostgreSQL are also available.