Town Sharpens Proactive Sewer System Management
By Alan Saine, Civil Engineer, Town of Mooresville, North Carolina
Highlights
- GIS has helped staff identify and remedy problem spots—a process that used to take weeks but now takes minutes.
- GIS was used to calculate the number of sewer mains that were cleaned that month and their lengths.
- Through Python automation, it was easy to use ArcGIS to display all the cleaning data.
In 2010, the Town of Mooresville, North Carolina, began experiencing a rise in the number of sanitary overflows and sewer stoppages. The reason for the problem was evident: the Town of Mooresville has more than 6,000 manholes and 250 miles of sanitary sewer gravity-main lines, and only 30 percent of that infrastructure has been constructed in the last 20 years. In addition to aging infrastructure, the Town of Mooresville population has tripled in the last 20 years, thus putting more strain on the significantly aged sanitary sewer system.
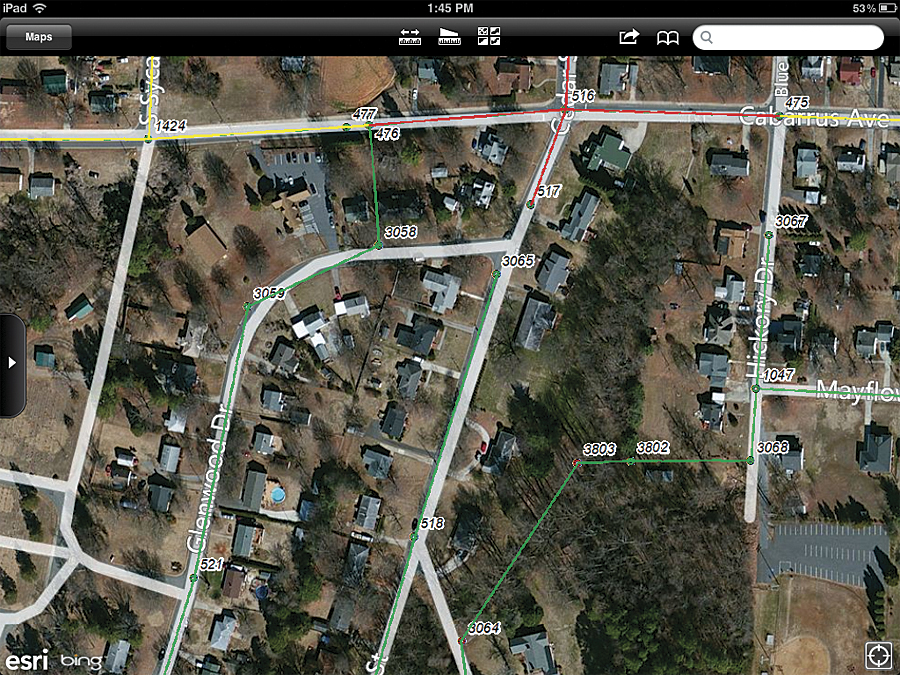
The Esri application on the iOS device displays the sewer cleaning data and the Manhole IDs (MHIDs); therefore, the user knows if that line has been cleaned recently.
Mooresville, like most municipalities, has permit requirements—in this case regulated by the Division of Water Quality, a division of the North Carolina Department of Environment and Natural Resources. One of the requirements is that the permittee shall assess all cleaning needs and develop and implement a program appropriately cleaning all sewer lines. The Mooresville Water/Sewer Maintenance Department (WSMD) manages this requirement on a day-to-day basis and recently requested the assistance of the Engineering Department to help determine all the distressed spots, or hot spots, to more strategically and effectively clean and maintain the system.
"Economic growth kept our staff very busy for years with installing all the water and sewer taps," says Jamie Johnson, water/sewer maintenance field supervisor. "Since the growth slowed due to the recession, we had to move from a reactive approach to being proactive. In the past, crews would alternate cleaning sewer lines in whatever area they wanted to, and areas were being left out. By restructuring crews, we dedicated a crew to do all the line cleaning, and with this continuity, we were able to grasp the needs of our wastewater collection system."
To assist WSMD in identifying distressed spots on the system, the Engineering Department needed to pinpoint these locations on a map and assign dates for when the sewer features (manholes, sewer main) were cleaned. WSMD maintained monthly data, from August 2009 to January 2011, in Microsoft Excel spreadsheets of where and when the sewer cleaning occurred. Each spreadsheet contained the cleaning data for that month, as well as a unique identifier, Manhole ID (MHID), to capture the location. Fortunately, the Engineering Department had recently finished a yearlong project, which employed ArcGIS software, to locate, map, and input all the features of the town's sanitary sewer system. Once the spreadsheets were reviewed, Python scripting was chosen as an optimal way to process the batch of Excel format cleaning data and generate a comprehensive dataset.
Automating with Python
Creating the cleaning data would require the repetition of several steps; this process was simplified using Python. The Python script was developed so that users would have the Excel file in a folder on a computer, and they can extract the month and MHIDs from it and perform several analyses. The Python script was made accessible to any user via ArcGIS.
The first step was to create the cleaning data. ArcGIS was used to calculate the number of sewer mains that were cleaned that month and their lengths. The frequency of how often a line had been cleaned was calculated and coded using a red/yellow/green scheme. Hot spots, or areas that had been cleaned seven or more times, were displayed as red so it would be evident where there were issues.
Locating the Cleaning Hot Spots
The ability to map where the sewer cleaning was occurring and how often it occurred yielded some interesting results. There were over a dozen separate areas where the sewer mains had been cleaned 7 to 12 times in an 18-month span. This information became a catalyst for improved interdepartmental communication between WSMD and the Town of Mooresville Fat Oils Grease (FOG) Department.
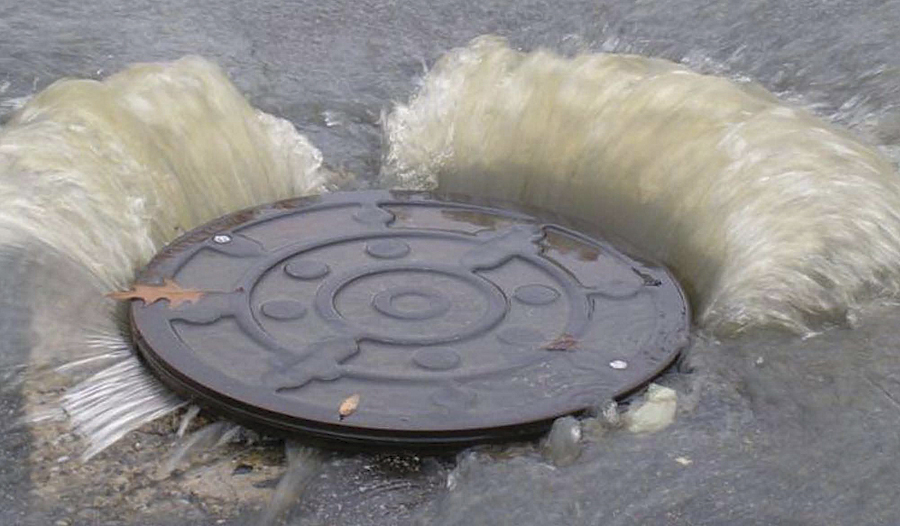
A sewer overflow.
Says Jamie Levis, FOG compliance officer, "Our sewer cleaning map has helped us identify those areas that require more frequent inspections and increased pumping/cleaning frequencies for food service establishments. The use of GIS has helped the FOG staff identify and remedy problem grease interceptors [problem spots] on multiple occasions. With the use of this tool, what used to take weeks now takes minutes to look up and identify."
Fixing the Hot Spots
Mapping the hot spots gave WSMD and the FOG Department specific areas to target and improve. Several methods were used to investigate these areas, such as reviewing closed-circuit television of the sewer mains and inspecting all the oil/water separators in the vicinity of the sewer cleaning hot spot. Several problems were fixed by using simple root control treatments and locating grease violations by local restaurants.
Prior to this project being implemented, in 2010, WSMD did not know where the hot spots were and did not have a way to track areas that were being repeatedly cleaned. In 2010, the town cleaned 51 miles of sewer mains. Of those cleaned sewer mains, 58 percent had already been cleaned earlier that year. In 2011, after the project, the town cleaned 144 miles of sewer mains, and only 32 percent were repeats. By having the ability to identify hot spots and correct issues, the town was able to clean almost three times as many areas and cut the repeat trips by 26 percent.
"Since our productivity has increased, we have noticed a decrease in main line stoppages and after-hours callbacks, resulting in cost reductions, including less overtime pay for employees," says Johnson.
Ryan Rase, deputy town manager, also praises the results of the project: "The WSMD has not been immune to the downturn in the economy, and we are constantly being asked to do more with less. Through the use of technology and teamwork, we were able to provide a tangible example of how WSMD has been able to become more efficient."
Going Mobile
Today, the town continues to map the sewer cleaning. Using Esri's ArcGIS, workers can now use iPads to log cleaning data directly into the system from the field (instead of keeping track of Excel spreadsheets). The sewer cleaning crew can instantly view where the cleaning truck has been in the past two years and be strategic in cleaning by maximizing the route of the cleaning crew and migrating to areas that need attention. Additionally, it can easily identify hot spots that show up red on the map and communicate where customer intervention may be needed. This project created a proactive approach to maintaining the town sewer system and enhanced interdepartmental communication.
About the Author
Alan Saine is a civil engineer and engineering intern at the Town of Mooresville in North Carolina. He is a graduate of the University of North Carolina, Charlotte, and is currently pursuing his master's degree in geospatial information science and technology at North Carolina State University. At Mooresville, he recently finished implementing an enterprise GIS system in the Public Services Division. He is a member of URISA, is currently working toward his GISP, and plans to sit for the Professional Engineering Exam in 2013.
For more information, contact Alan Saine, civil engineer for the Town of Mooresville (tsaine@ci.mooresville.nc.us).
Related Podcast
ArcGIS for Local Government Simplifies Government Workflows
Scott Oppman, local government solutions project manager at Esri, gives a technical overview of Esri's solution for simplifying GIS workflows in local governments. Listen to the podcast. [07:00 | 7 MB]