Developing a GIS-Based West Nile Virus Infection Model
Continued...
Climatological Evaluation
 |
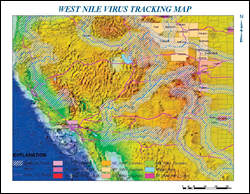
| This map displays major roads, rivers, and lakes and 30-mile river buffer features showing the affected counties in Wyoming, Nebraska, South Dakota, Colorado, California, New Mexico, and Texas. The map was created by the author using ArcMap. |
A thorough review of interpretive GIS climate maps was conducted to see if there were any correlations between the spread of the WNV and climatic changes (i.e., to test and validate the second component of the human WNV infection model). Based on a review of the summary data, the following observations can be made:
Human WNV activity appears when the upper end of the third quarter regional temperature range exceeds 80�F. Furthermore, a unique episode of above normal temperatures occurred during the third and fourth quarters of 2002.
There appeared to be elevated precipitation in the third and fourth quarters of 2002, the period of highest WNV human activity, in the East and Midwest compared to those quarters in 1999, 2000, and 2001. In fact, the precipitation in Louisiana during that period was the wettest on record. This deluge following a dry period would have provided conditions favorable to the population growth of the Culex pipien. This would have likely resulted in viral amplification in these regions, which validates the second and third components of the human WNV infection model.
Regardless of the climate, there is currently no record of human WNV activity prior to the third quarter of each year.
Geographic Location Evaluation
Reviewing interpretive GIS geographic location maps was conducted to see if there were any correlations between the spread of WNV and geographic locations or proximity to certain geographic features. Based on the data presented on GIS maps, the following observations can be made, which validates component C1 of the human WNV infection model.
 |
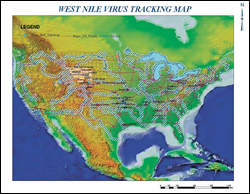
| This map shows rare bird sightings as turquoise circles. It was prepared using Cornell University's Project FeederWatch Rare Bird Sighting reports for the 2001-2002 season. This map was prepared by the author using ArcMap. |
Within affected states, the initial WNV human activity (or WNV animal activity if no human case data was available) appears to occur primarily in those counties within 30 miles of major rivers (including the Great Lakes and ocean coastlines) or in those counties situated along or immediately adjacent to major roadways ("stowaway bugs").
WNV activity was also observed in several counties located immediately adjacent to those affected counties meeting the above criteria.Although exact elevation ranges cannot be obtained from the generalized global benthic map, the following can be deduced: WNV activity in the Mississippi River corridor occurs at an elevation of less than 2,000 feet MSL, while WNV activity in Wyoming occurs at elevations greater than 4,000 feet MSL.
Rare Bird Sightings in Corridor Areas
Since migratory birds have the potential to carry WNV, a rare documented appearance to a new geographic area would be significant. A thorough review of Cornell University's Bird Source annual rare bird sighting summaries that are part of Project FeederWatch was conducted to see if there was any noticeable increase in bird sightings in specific geographic areas. Based on this information, there appears to have been a slight increase in rare bird sightings in Canada and the United States during the 2001-2002 season. Of the 35 rare bird sighting locations, all were within the river, major road, major lake, and/or coastal corridor areas. These documented sightings were most highly concentrated in the Midwest and on the East Coast during one of the worst WNV seasons. This appears to validate the first two components of the human WNV infection model.
Conclusion and Recommendations
It is imperative that environmental managers appreciate that climate and geographic locations appear to play a role in the WNV transmission cycle. Recognizing the significance of particular climate trends and specific locations would alert managers of the high potential for human WNV transmission in these areas.
Based on the results presented in this study, all three components of the human WNV infection model were validated. The GIS spatial data layers generated for this study as part of a human WNV infection model could assist environmental professionals (e.g., risk/planning managers and epidemiologists) in making risk management decisions. For more information, contact
Martin Minter at mminter@jbrenv.com
Online References
Centers for Disease Control and Prevention, Division of Vector Borne Infections, West Nile Virus Questions and Answers Web page. Retrieved January 9, 2003, from www.cdc.gov/ncidod/dvbid/westnile/qa/transmission.htm
Cornell University, Department of Communication and Center for the Environment, Environmental Risk Analysis Program West Nile Virus: Transmission, Infection, and Symptoms Web page. Retrieved May 28, 2003, from environmentalrisk.cornell.edu/WNV/Summary2.cfm#birdmap
Cornell University, Lab of Ornithology, Project FeederWatch Web site. Retrieved May 26, 2003, from http://birds.cornell.edu/pfw/DataRetrieval/dataretr_index.html
National Oceanic and Atmospheric Administration Climate at a Glance Web site (source for historical climate monitoring data). Retrieved February 1, 2003, from lwf.ncdc.noaa.gov/oa/climate/research/cag3/cag3.html
United States Geological Survey West Nile Virus Maps Web page. Retrieved December 25, 2002, from cindi.usgs.gov/hazard/event/west_nile/west_nile.html
E-Mail Research Sources
Matt Pelikan, editor of Winging It for the American Birding Association
Lynn Tennefoss, vice president of state programs and chapter services for the National Audubon Society
John Trapp of the Division of Migratory Bird Management for the U.S. Fish and Wildlife Service
|