CASI Data Provides Better Picture of Coral Reef Threats
Continued...
Generating a series of habitat maps for the same area over a period of time allows the detection and measurement  of the changes in habitat boundaries. Integrating other data, such as commercial fishing data, water profiling, storm patterns, and runoff from nearby land masses, can make habitat maps even more powerful and help answer why changes occur in coral reef ecosystems. This data is integrated in a GIS database. Habitat maps, linked and integrated with other datasets in a GIS, bring information closer to decision makers and those tasked with managing these essential resources. of the changes in habitat boundaries. Integrating other data, such as commercial fishing data, water profiling, storm patterns, and runoff from nearby land masses, can make habitat maps even more powerful and help answer why changes occur in coral reef ecosystems. This data is integrated in a GIS database. Habitat maps, linked and integrated with other datasets in a GIS, bring information closer to decision makers and those tasked with managing these essential resources.
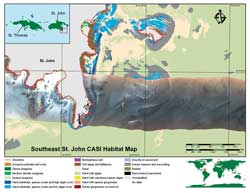
LOF chose the St. John and St. Thomas CASI dataset to prototype an initial GIS database. CASI data collected during the USVI project contains 16 spectral bands with a two-meter resolution. HDI performed the corrections and georectification and delivered more than 60 GB of imagery to LOF in ERDAS IMAGINE format. Processing this data revealed reefs, previously unknown, that had not been detected by aerial photography or satellite imagery. In addition to the CASI data, Mumby's group delivered raster habitat maps for St. John and St. Thomas that display each bottom type at a two-meter resolution. The deliverable also included video clips captured by divers that illustrate examples of each bottom type.
The CASI imagery and habitat maps were integrated into a functional database. Shoreline, bathymetry, coastal features, adjacent land cover, and other layers are being sought and added to the database. With this data, advanced overlay and spatial analysis can be performed. Although CASI flight line averages 1 to 1.5 GB, they don't necessarily capture the required geographic phenomena and must be mosaicking with adjacent imagery.
It immediately became apparent that quickly accessing, redrawing, and querying the CASI data would be challenging. Upgrading hardware is often the first step taken to improve computing performance. However, displaying multiple flight lines or a mosaic of all flight lines simultaneously can tax even the most capable workstations. To address these challenges, LOF began building a GIS laboratory by investing in a Dell Dimension 670 with dual Xeon processors and 1 GB of RAM. LOF also selected ArcGIS for its ability to display and analyze large raster datasets and integrate the data with other data layers into a database.
The CASI Database
Preparing the database began with examining CASI imagery specifications and determining how best to display the data. Since the imagery was intended to support further research and analysis, images needed to be stored at full resolution using a lossless compression method. The database also needed to quickly draw imagery in the display. Because the study area was limited to St. John and St. Thomas, the extents could be minimized. This easily allowed the full imagery, with a resolution of two meters, to be used.
Having identified the geometry and extents, CASI flight lines were then imported into a raster catalog within an empty geodatabase. Although this was a laborious process, the benefits of working in the geodatabase environment were immediately realized. Drawing the imagery from the raster catalog was much faster than drawing the raw flight line files. Identifying items and executing queries also took less time.
The CASI raster habitat maps were also added to the geodatabase as a raster dataset. The raster maps were converted to polygons and a new field added to the polygon layer's attribute table. That field was populated with field-based links to the video clips of bottom types. The polygon layer provides a way to geographically link tabular data to the database using joins.
Future Development and Objectives
A functional CASI GIS database is currently being populated, but it is only accessible to users at the LOF GIS laboratory. LOF has investigated several options for disseminating this information ranging from simply posting static maps on the LOF Web site to creating a fully interactive online GIS. In keeping with its mission, LOF determined that furthering coral reef research would benefit most if the data was made available through an interactive online GIS. While hard-copy maps and other types of output products will be generated, the online GIS will be the first priority as it makes the most recent data accessible to more people.
Plans to make this data available to the public are well underway. However, several critical components must be acquired and deployed. One of the most important, but missing, components is the capability to publish and serve interactive maps. LOF chose ArcIMS as the tool for this task because its out-of-the-box functionality would make this data available in a timely manner without waiting for the researchers' more elaborate Web portal to be developed. ArcIMS also allows for highly customized interfaces and the development of Web portals. Two other LOF-sponsored projects in other parts of the world will undergo similar development.
This mapping project will help create and disseminate information on threats to coral reefs, which can help decision makers and slow the rates currently projected for coral reef destruction.
For more information, contact
Michael Plakos
GEOMAR Research, Inc.
mike.plakos@verizon.net
About the Author
Michael Plakos received a master's degree from East Carolina University in maritime studies (i.e., maritime history and underwater archaeology) and a bachelor's degree from Western Washington University. He is co-owner and senior scientist for GEOMAR Research, Inc.
|