Coming to Terms
Circuit-A discrete portion of the electrical power delivery system, continuous from a single circuit breaker at the substation to a set of customers. It is also referred to as a feeder.
Distribution-Delivery of a commodity such as gas, electricity, or water to the end consumer. The analogous system for sewer utilities is the collection system.
Lift station-A facility or group of facilities used to move flow from a lower to a higher elevation. This is a key facility to the sewer utility.
Main-The backbone or principal line facility in the distribution system for gas, water, sewer, and sometimes electrical systems.
Meter-The measuring device used to monitor the customer's use of the commodity.
Premise-The location of the consumer. Occasionally this term refers to a facility or location within the network model.
Pump station-A facility or group of facilities used to increase or occasionally decrease pressure. This is a key facility for a water utility. Right-of-Way-or easement is a grant to locate facilities on an area of real property.
SCADA-Supervisory Control and Data Acquisition is a remote monitoring and control system. This term is traditionally applied to the transmission system but has been more recently used with regard to distribution systems.
Service-The last element of the network before the customer takes ownership. Typically, it is a line, cable, or pipe dedicated to one consumer.
Service point-Point of delivery of the commodity or the end of the service line.
Transmission-Bulk delivery of a commodity such as gas, electricity, or water for redistribution or resale. Typically, transmission lines operate at a higher volume, pressure, or voltage than distribution lines.
Vault-An underground pit where facilities are accessed and junctions or connections are made.
The Convergent Group of Engelwood, Colorado, has developed a decision
support tool for a gas utility marketing department based on ArcView GIS.
Five customized ArcView GIS applications were developed using Avenue,
Dialog Designer, and PresenTable from Applied GIS, Inc. to allow the client
to market more effectively in both regulated and deregulated markets.
The Client's
Goals
Convergent Group's
client must market products and services for a gas utility that works
in both regulated and unregulated market areas. This client wanted tools
to analyze existing residential, commercial, and industrial customers
and to determine the products and services that were sold to those customers.
To better analyze existing and potential customers, the client also wanted to create segments based on common characteristics to aid in targeting specific products and services to customers.
The client also wanted data and tools to look into other geographic areas outside regulated service areas in search of potential customers as well as to protect existing contracts from competitors. In particular, the client wanted to prevent customers from bypassing their company and tapping into interstate pipelines.
Finally, the client wanted a system for tracking the success of its sales force, displaying results, and reporting in tabular, chart, and map formats for corporate presentations, mailing lists for marketing pieces, and leads lists for direct sales activities.
The Applications
 The
five applications that are used for market planning integrate the spatial
components of external data sources with the client's internal data. Using
these applications, the client can learn more about existing and potential
customers. Customer and potential customer base data are segmented so
specific products and services can be targeted to customer groups based
on spatial and aspatial criteria. Actual sales are tracked and compared
with marketing goals. Also, customers whose location could allow them
to connect directly to interstate pipelines are identified. The applications
have customized query, analysis, thematic mapping, and reporting functions.
Customized maintenance utilities allow for additions to the data model.
Conceptual
Model
The client wanted a
system that would allow them to group customers by specific characteristics.
From the requirements definition, Convergent Group prepared the following
list of conceptual objects and their definitions.
Customer-An
individual residential, commercial, or industrial customer. A customer
has only one account number. A customer is a base class and a customer
record includes the following attribute information: Name
Address
Account Number
Energy Usage
Energy Expenditures (Revenue)
Products and Services Purchased
Segment
Last Segment
Segment Date
Standard Industrial Classification (SIC)-A four-digit code developed by the Office of Management and Budget to facilitate statistical economic analysis and reporting by the government. Segment-A grouping of customers, based on common characteristics such as SIC, energy consumption, or number of employees. A customer can be in only one segment at a time and typically stays in a segment for one to three years. Segments can be made up of customers or potential customers in different themes.
Target-A grouping of customers who might buy a specific product or service. Target groups are smaller, more specific groups based on common characteristics. Targets can cross-segment groupings and can be made up of customers or potential customers in different themes. A customer can be in more than one target group at a time.
Product/Service-Something the client sells: a commodity such as volumes of gas sold at a particular rate, a specific item such as a gas-powered air compressor, or a service such as a repair contract on appliances. Many customers purchase several products or services at once. The client also wanted to track goals and actuals for sales territories, sales representatives, and products and services. To support the tracking application, the following conceptual objects were created.
Goal-An objective for a particular sales representative, sales territory, product or service, target, or segment. Goals are numeric in nature and must be in one of the following categories:
- MCF-Thousands of
cubic feet, a measure of gas volume
- UNITS-Number of
individual items such as water heaters or forklifts
- MARGIN-In dollars
Sales Territory-A geographic area covered by one or more sales representatives that has one or more goals associated with a product or service.
Sales Representative-A member of the sales force assigned to one sales territory that has goals associated with a product or service.
Design
and Development
 All
spatial data in these applications are in shapefiles. All aspatial attribute
data are stored in .dbf file format. The application, based on a single
customized ArcView GIS project, has five custom DocGUIs-one for each major
application. Each application has custom menus, tools, buttons, and a
standard default view as well as maintenance utilities. A simple customized
GUI was the best solution because the user group had various levels of
experience with graphical user interfaces and GIS.
The
Planning Application
Users can investigate potential markets by geographic region, utilizing
county business pattern data by SIC codes, and average energy use patterns
that have been compiled based on the client's existing customers.
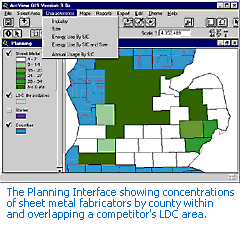
Typically, the user will select a geographic region to investigate such as a state or a competitor's Local Distribution Company (LDC) boundary. The user then selects the characteristics of industries in that area. By creating thematic maps, concentrations of these industries by SIC and size can be located. The user can also view the annual energy use patterns of those industries by the size of the establishments.
Segmentation
and Targeting Applications
 The
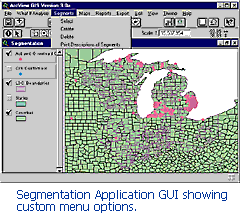
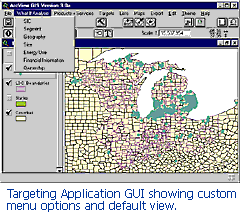
segmentation and targeting applications have similar functionality. Both
work with geocoded point data themes that represent existing customers
and potential customers. Multiple customer data themes are allowed. All
customized queries will work on all customer point themes in the project.
Segments and targets are subsets of the customer themes based on specific characteristics. Targets are usually subsets of segments. Performing a "what-if" analysis defines a segment or a target. Each time a user selects a query, an "AND" restriction is added, reducing the size of the selection set.
For example, the client wants to create segments of large industrial customers that support the automobile industry because these kinds of customers use lots of natural gas. First, the user could select a geographic area such as a state that includes both existing customers and customers of competitors. Next, a query-based SIC would return customers in the industry of interest. Finally, the number of employees or some other criteria could be used to further refine the selection.
The user can then generate a leads list, mailing labels, or a telemarketing list for the sales force that includes all of the customers and potential customers to be targeted.
Tracking
Goals and Actuals Application
Using the tracking application, users create goals for segments, targets,
sales territories, and sales representatives, then compare the actual
results to the goals. All goals must be associated with margin, consumption,
or other numeric measures. Reports can be generated based on goals and
actuals for specific sales territories, sales personnel, segments, or
targets.
Bypass
Identification Application
This application is mainly a proximity analysis application. To prevent
large industrial customers from bypassing the client's LDC and tapping
directly into an interstate pipeline, the client needs to locate large
industrial customers who are within a mile of an interstate pipeline and
in danger of tapping into these pipelines.
Interstate natural gas pipelines are thematically displayed on the screen. The user selects one or more customers by segment, location, or consumption, and then selects one or two buffer distances. The application selects all interstate pipelines within the specified distances of the selected customers and displays them on the screen.
A report can then be generated to show which customers are within the selected distances of interstate pipelines, which pipeline the buffer intersects, and the distance from the customer. This identifies both the competing pipeline and the customers who are at risk. Similarly, the analysis can be completed by selecting and buffering a pipeline and by finding all customers within a certain distance of it.
Integrating
PresenTable for Reporting
PresenTable Developer's Kit from Applied GIS, Inc., of Schenectady, New
York, was used to supply reporting capability to produce leads lists,
telemarketing lists, mailing labels, and other basic reports.
PresenTable provides wizards for basic report creation, as well as an interface for designing reports. With Developer's Kit, custom reports are created in Avenue scripts that are run from a library using the PresenTable run-time executable rather than the full extension. When these custom reports are called, the PresenTable run-time executable provides the same viewing and printing interface as the full version. Reporting functions are accessed from the GUI of each application.
Data
Maintenance
For each application, users needed maintenance utilities that let them
add to customer files, add new products and services, and resegment the
customer base. Each maintenance utility has a customized panel for easy
and consistent update of data. All data maintenance routines are password
protected to avoid unauthorized editing of data.
Data
Sources
Both internal and external data sources were used. Customer data were
extracted from the client's Customer Information System (CIS) database
and the sales team's contact management software, and purchased from Dun
& Bradstreet. A match-and-append operation using CIS records against Dun
& Bradstreet data provided more up-to-date SIC information.
All other data were produced from the customer's existing data sources, either on paper or in digital format. Data purchase and processing was a significant cost in this project and exceeded original estimates. The majority of the data was provided in CD-ROM format.
Deployment
of Applications and Data
Spatial and aspatial data used in the analysis were placed on a Windows
NT server on the client's Novell network. All data were placed in a prescribed
directory structure on the server, with a mount point that was visible
only to the members of the client's department. Several Windows NT environment
variables were created at the operating system level to allow data to
be relocated if necessary.
Each client PC has a copy of ArcView GIS as well as the dynamic link libraries and .dat files required by Dialog Designer and the PresenTable run-time executable file. The PresenTable run-time executables and temporary .dbf files for reports are stored in specific directories outside the Esri directory tree so that files cannot be altered or deleted accidentally. The ArcView GIS project file that contains the applications was placed in the user's home directory.
Conclusions
These customized applications let novice GIS users access the power of
spatial relationships when defining new segments and targets. By integrating
internal data with external spatial and aspatial data, the client can
market more directly to specific types of customers. Customized maintenance
utilities allow the client the flexibility to integrate more external
data sources into the decision support system over time.
This article was based on a paper written for the 1998 Esri User Conference.
Jennifer Sanborn
Software Engineer
Convergent Group
6200 S. Syracuse Way, Suite 200
Englewood, CO 80111
Tel.: 303-741-8566
Fax: 303-741-8401
E-mail: Jennifer.Sanborn@cvg-grp.com
About
the Author
Jennifer Sanborn is a software engineer at Convergent Group, a consulting
and systems integration company in Englewood, Colorado. She has a master's
degree in Geographic Information from the University of Maine's Department
of Spatial Information Science and Engineering.
