ArcWatch: Your e-Magazine for GIS News, Views, and Insights
August 2011
Esri Community Analyst
Create Your Own Maps and Reports Using Thousands of Data Variables at Your Fingertips

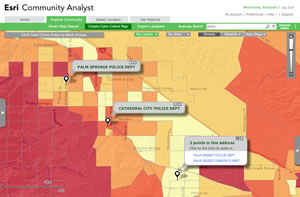
Crime indexes can be studied using Esri Community Analyst. The areas in red have a higher crime index than other areas in the map. Viewing this information in relation to the location of police departments can help determine where additional resources are needed.
The new Esri Community Analyst provides fast access to intelligent color-coded maps and thousands of data variables that combine to paint a complete picture of the unique characteristics that make up a community. While this cloud-based mapping solution contains sophisticated tools to help you select, visualize, and analyze data, the easy-to-navigate interface means that even those with limited geographic information system (GIS) experience can immediately map information and create reports as they realize the benefits of looking at their data in a whole new way.
Quick and Easy Data Access
Data users typically pull the variables they need to create maps and reports from a variety of different sources. Community Analyst combines thousands of data variables from both public and private sources, allowing users to easily compare and analyze them.
For example, you can select variables such as average age, household income, and education levels from Esri's Updated Demographics data about people living in a certain geographic area and combine it with the US Department of Health and Human Services' Community Health Status Indicators (CHSI) variables and the latest US Census data. Now you can see detailed demographic information about this group, as well as their access to health care and preventive care services. A variety of agencies and organizations would find this information useful, including city governments applying for grants for parks and recreation programs or community planners trying to improve the overall quality of life for their residents.

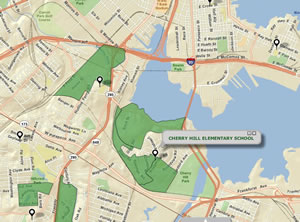
Community Analyst can be used to find the best locations to set up flu shot clinics, including where large numbers of children live in low-income neighborhoods.
Detailed variables about demographics, the economy, education, supply and demand, health, crime, transportation, spending, behavior data, and more, are all included in an annual subscription. Esri hosts Community Analyst in the cloud, so there is no need for your organization to install updates, and you will always be able to access the most up-to-date data.
Reliable Data
To ensure data accuracy, Esri's data development team has applied its own update methodologies and GIS tools to integrate disparate data sources and perform validity checks on its data. For example, during periods of major population change, such as after Hurricane Katrina struck the US Gulf Coast, Esri sent a team to these areas to conduct a ground truth check and used the visual image of these sites to help improve the accuracy of its predicted demographic forecast data. Esri's team of economists, statisticians, demographers, geographers, and analysts has developed proprietary datasets available in Community Analyst that are considered industry benchmarks, including Updated Demographics, Tapestry Segmentation, Consumer Spending, Market Potential, and Retail MarketPlace.
Updated Demographics and Predictive Data Forecasting
Esri releases current-year estimates annually, along with five-year forecasts for demographic variables such as population, age by sex, race by Hispanic origin, home value, labor force and employment, educational attainment, and household and family income. This updated data is critical if you need to determine the effect that population change, local unemployment figures, and housing values are having on constituents.
Using Community Analyst, city planners can view this data as an intelligent web map to ensure their housing and infrastructure plans are ready to meet future population demands.
Adding Value to Census and American Community Survey Data
In 2010, the US Census Bureau changed how it collected decennial census data by eliminating its traditional long form and replacing it with the American Community Survey (ACS). The ACS collects data on income, poverty status, education, the labor force, commute times to work, marital status, languages spoken, ancestry, and home value. To enable users to better understand the ACS estimates, Esri's data development team created a system of proprietary Reliability symbols that clarify the ACS Margin of Error (MOE).

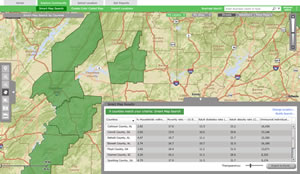
You can use Smart Map Search to compare up to five variables at once. The results of this search show counties (highlighted in green) with high concentrations of obesity and diabetes rates and a population with limited access to grocery stores and health care.
Using Community Analyst, you can immediately and easily analyze both Census 2010 and ACS data in standard census geographies, such as counties and block groups, but can also generate custom analyses for geographies not available from the Census Bureau, including ZIP Codes, drive times, and hand-drawn polygons.
The federal government uses the data to help decide where to allocate funds and develop policy, while local governments use the data to plan for and respond to disasters. ACS data also supports planning for building schools, roads, and hospitals.
A Snapshot of Supply and Demand
Economic developers anxious to attract new businesses to their area need a complete, current, and accurate snapshot of the retail marketplace to make strategic decisions. Bringing the right business to town can mean the difference between a community's success and failure and ultimately affects an area's employment rate, tax revenue, quality of life, and more. Community Analyst comes with Esri's proprietary Retail MarketPlace data, which you can use to view the retail market sales and consumer demand for 13 industry groupings including food services, clothing stores, and electronics. This data is instantly customizable in Community Analyst. You can view it for any size ring or custom polygon, ensuring you have data based on your area of interest no matter how small the county or block group.
The Fabric of America's Neighborhoods
Community Analyst also provides Esri's Tapestry Segmentation, which classifies US residential neighborhoods into 65 unique market segments. Tapestry Segmentation provides detailed information about the demographic composition and lifestyles of neighborhood residents. Now you can better understand the product, service, and media preferences of area residents by lifestage in order to supply them with suitable services and products and communicate with them using the most effective channels. The benefits of understanding the types of people who live in an area are broad in scope, ranging from identifying special needs populations, creating effective disaster evacuation plans, providing viable consumer options, and boosting marketing response rates.
Visit esri.com/ca to learn more about Community Analyst. Sign up for a free, 14-day trial and watch these Community Analyst demonstrations.