ArcWatch: GIS News, Views, and Insights
September 2012
Which Is Better?
Seattle or Portland? Compare the Two Side by Side Using a Web Mapping Application Created with ArcGIS Online
Inspired by CNN Travel's "City Smackdowns," a new web application developed at Esri using ArcGIS Online lets people compare demographics and quality of life in two cities: Seattle, Washington, and Portland, Oregon. Using GIS, they can determine the winner!
CNN Travel ran a series of articles this summer called "City Smackdowns" where neighboring communities in the United States vied for the readers' recognition as the best community. In one of the latest smackdowns, Seattle took on Portland.
Building on that example, the application analyzes what makes Portland and Seattle good places to live. It also compares how each city stacks up against each other.
Developing the application only took two and a half days, start to finish. Little programming experience was needed.
The project demonstrates the vast capabilities of ArcGIS Online, including accessing data and creating and sharing maps. ArcGIS Online offers a variety of ways to share your maps. They can be embedded into a web page or shared via e-mail or social media. Access to the maps also can be made private or restricted to employees or a group within your organization.
The application created to compare Seattle and Portland uses data that reflects the quality of life in each of the communities, including:
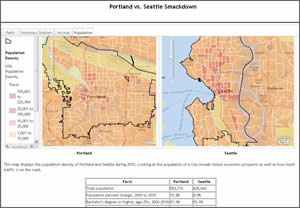
- Population and the population density of each city. (Seattle edges out Portland here.)
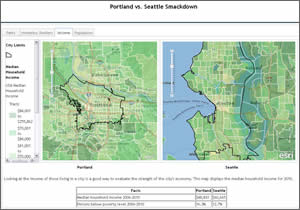
- Median household income (It's about $12,000 a year higher in Seattle.)
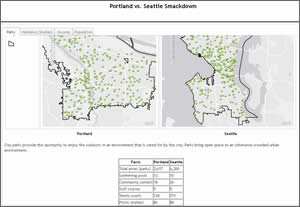
- Park acreage (Seattle has almost double Portland's acreage.)
- Number of homeless shelters in both Portland and Seattle (Portland has slightly more than Seattle.)
The ArcGIS API for JavaScript examples and the templates from storymaps.esri.com were very helpful in creating this application.
ArcGIS Online makes it easy to create maps and find geospatial data. ArcGIS Online is home to a plethora of user-created geospatial data, ranging from brewpub locations to UFO sightings. ArcGIS Online includes a search engine that looks for data with tags that match keywords that the user enters.
A paid subscription is required to host feature services on ArcGIS Online. However, most Esri web mapping APIs are available for no charge. And anyone can create a free personal account to access the large catalog of user-created data and create web maps of their own.
Creating the web mapping application began by finding all the required data about each city at ArcGIS Online. Some data required additional processing. That was done in ArcGIS for Desktop. Portland's park data was in the form of polygons, while Seattle's parks were points. To compare these datasets, the Portland polygons were opened in ArcGIS for Desktop and converted to points with the Feature To Point geoprocessing tool.
After the data had been compiled, a web map for each set of data was created that showed each city. Maps for both Seattle and Portland showed public parks, homeless shelters, median income, and population density.
The web maps were next configured to display the data in an appealing and easily accessible fashion. Symbols were chosen that fit with the overall look and feel of the application and were appropriately scaled to minimize overlap. The pop-up editor was used to create pop-up windows that presented data in a meaningful way. This involved removing the unnecessary fields such as latitude and longitude. The pop-up editor is also capable of generating pie charts and bar charts using data from feature attributes.
The next step was to embed the maps in a web application using HTML and ArcGIS API for JavaScript. Esri offers many great samples (with codes provided) of mapping applications that were developed using the JavaScript API at the ArcGIS Resource Center. These examples were invaluable while designing this application. The goal of this application was to display the maps for both cities side by side while having multiple tabs to allow users to select what dataset they wished to view. Because no sample offered exactly that, it was necessary to develop a new application. By taking JavaScript code from two of the samples (one using a tab container, the other displaying two maps at once), the new application was quickly developed.
In addition to the web maps, tabular data was included on each tab that was not appropriate to display in the maps. The tables included information such as average commute time to work and total population. Most of this data came from the US Census Bureau.

Portland beat Seattle in the CNN Travel "City Smackdown." Mount Hood is in the background. Photo courtesy of Portland Travel.
CNN polled readers, who named Portland as the best city. Perhaps the results would have been more objective and scientific if CNN had used GIS to compare the two cities.
Minimal programming experience is required to develop an application like this one. Most of the code can simply be copied from existing samples and pieced together with little trouble. ArcGIS Online also offers premade mapping applications that can be accessed through the sharing tools in the web map. If you are considering purchasing a subscription, sign up for the 30-day free trial.
Building this application demonstrates one way of implementing ArcGIS API for JavaScript, but many new and unimagined applications await your discovery. What will you make?
