In the aftermath of Hurricane Sandy, which struck the northeastern United States in 2012, New York State Electric and Gas (NYSEG) and Rochester Gas and Electric (RG&E) saw an opportunity to enhance their emergency response planning by improving data collection. Not long into the modification process, these two Iberdrola USA-owned companies used Esri solutions to turn their plans for hurricane response improvement into a new, all-events assessment strategy—a cost-effective overhaul that would impact nearly 3 million electricity and natural gas customers in upstate New York.

The Catalyst: Hurricane Sandy
Hurricane Sandy, a superstorm packing torrential downpours and 80-mile-per-hour (129-kilometer-per-hour) winds, roared into the northeastern United States on October 29, 2012. With damages totaling more than $65 billion, Hurricane Sandy is the second most destructive hurricane in US history, behind the Gulf Coast’s Hurricane Katrina in 2005.
While Long Island and New York City bore the brunt of the damage from wind, rain, and storm surge, more than 117,000 NYSEG and 27,000 RG&E customers were without power.
Shortly after the hurricane, New York governor Andrew Cuomo established the Moreland Commission to make recommendations for how New York State’s power utility companies could improve their responses to extended power interruptions. One outcome of the commission was the development of a utility scorecard, filed with the New York State Public Service Commission, to report on key performance indicators during outages lasting 72 hours or longer.
An essential performance measurement is how quickly utility companies can do a preliminary damage assessment. To comply with this feature of the scorecard and to improve their emergency response systems, the two New York-based Iberdrola USA companies, plus the Central Maine Power Company (CMP), sought to change from a manual damage assessment method to an automated system designed around a central data repository.
Pre-Sandy Storm Response
Although Iberdrola USA companies had begun enhancing their restoration processes—particularly their damage assessment practices—before Hurricane Sandy, these operations were still quite labor-intensive and time-consuming.
By 2012, damage assessors from NYSEG and RG&E were no longer bringing paper maps and tally sheets into the field. Iberdrola USA had gotten PDAs in 2006, which ran a customized version of Esri’s ArcPad. But six years later, the maps were only semiautomated; the geodatabases were only a bit quicker to access; and office staff still had to collate the data after collection, usually after hours. What’s more, the devices were stored at each division office, so before a storm, NYSEG’s GIS and mapping project manager, Stephen Hope, had to pack them up and drive them—sometimes through threatening conditions—to affected locations for fast deployment.
Working with Local Authorities
Local municipalities and counties had been looking for ways to leverage their own resources to assist with postemergency damage assessments as well, particularly in areas that had a lot of ground to cover. Hurricane Sandy made the need for collaboration even more apparent.
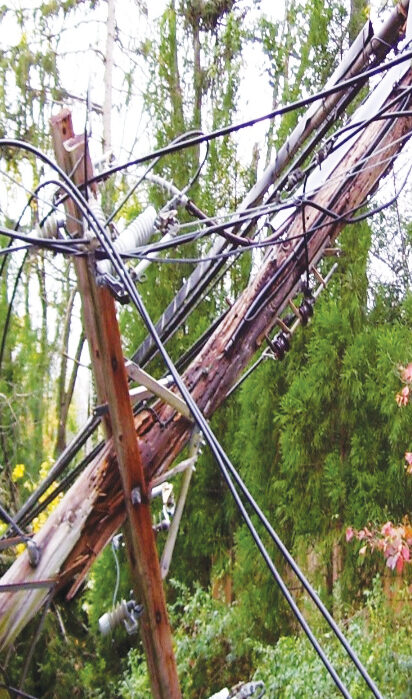
After the hurricane, secondary roads were in such disrepair that utility workers couldn’t access their equipment to complete even preliminary assessments of broken poles, downed wires, and damaged transformers. The municipalities asked if there was a way that their own workers could report damage to Iberdrola USA companies rather than having to wait for company assessors to get to their areas. Municipalities wanted to have access to Iberdrola USA’s database to record downed poles or blocked roads, for instance, complete with geographic coordinates, pictures, and details.
The utility companies thought this was a good idea, so Iberdrola USA’s IT applications manager, Paul Booker, and programmers Dean Hartley and Dick Abram worked in ArcGIS Online to make that happen. Moreover, this aspect of the project fell in line with the Moreland Commission’s recommendation that utilities collaborate more with municipalities.
A New Kind of Storm Recovery Collaboration
NYSEG, RG&E, and CMP were looking for a damage assessment solution that could be ready within about a year. With guidance from Esri, they came up with one that could be deployed quickly and easily and that fit their licensing packages.
In November 2014, the Iberdrola USA companies released a three-part GIS solution to make postemergency damage assessments more swift, collaborative, and comprehensive. It was one part mobile, one part web maps, and one part dashboard.

Part One: Mobile Damage Assessments
To help with its own damage assessments, Iberdrola USA launched the Esri Collector for ArcGIS app on 300 iPad minis with data plans and individual phone numbers. Hope worked with NYSEG’s manager of electric distribution quality assurance and quality control, La Wanda Ervin, to distribute these devices evenly across the company’s New York and Maine service areas so that damage assessors could be deployed quickly wherever a storm hit.
Field personnel can now more accurately report damaged assets in real time using online and offline editing modes. The iPad minis communicate with the utilities’ central geodatabase as soon as they enter cellular service zones. And data collection is map based.
“We did not use maps on the PDAs because the screen was so small,” Hope said. “With the tablets, the maps are large and easy to use.”
As fieldworkers record damage data, the tablets’ GPS automatically pans to that location. Technicians can drop pinpoints to mark assets that need to be repaired, and the back-office programming automatically identifies each asset by drawing location data from the nearest utility pole. Field crews can also input photos, enter the type and extent of the damage, and report nearby conditions. What’s more, assessors can communicate to and from the field using email or texting.
This system is more efficient and user-friendly than any of the utilities’ previous procedures, and it saves time and money.
“The feedback we received has been wonderful,” said Ervin. “The data coming in is more accurate, and most of our field technicians already used iPhones, so the technology is familiar to them. They love it.”
Part Two: Collaborating with Municipalities Using Web Maps
Right after a storm or other emergency, municipal workers can now call their dispatchers to report preliminary damage to utility infrastructure and access points. The dispatchers can then log in to the municipalities’ ArcGIS Online accounts and record the damages in the appropriate Iberdrola USA web map. Municipal personnel require minimal training to input the data, and the interface furnishes a simple way for municipalities and utility companies to work together to record damage assessments.
NYSEG has so far piloted this approach in three municipalities. Iberdrola USA hopes that more of the nearly 1,000 municipalities in its two-state service area join the initiative. They must have ArcGIS Online named user accounts, though, before they can participate.
Part Three: Monitoring Operations via a Web-Based Dashboard
Supervisors at all three utilities no longer have to wait to get field information compiled overnight. They can now monitor incoming data from the field on an in-house, Esri technology-based web application.
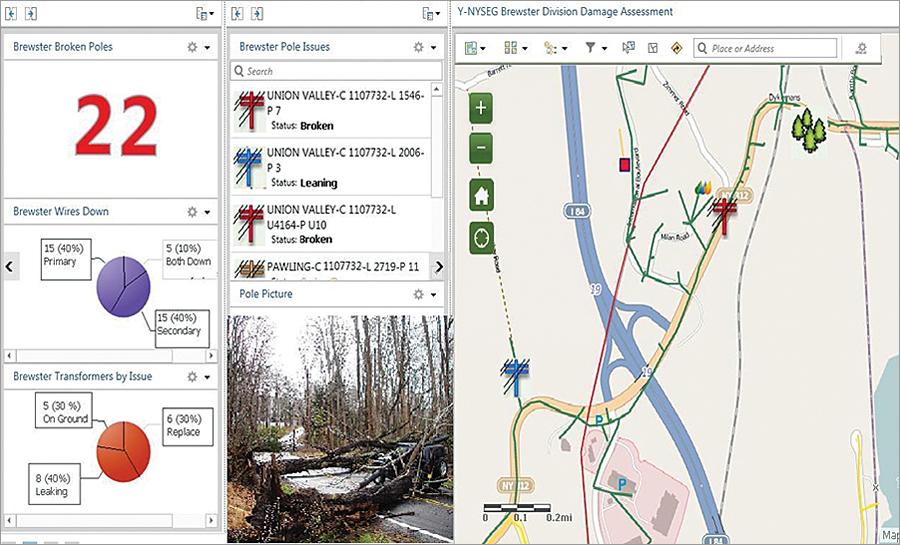
This higher-level dashboard view, available through ArcGIS Online, summarizes information such as the locations of downed primary and secondary wires, where transformers are leaking or need replacing, and how many broken utility poles there are. Training was minimal for this application too, said Hope, since the interface is so simple and intuitive.
Ticking All the Boxes—and Then Some
This three-pronged mobile, web, and dashboard solution was just what the Iberdrola USA companies needed. The quickly executed project lets utilities enter real-time damage assessment data, facilitates municipal involvement, and gives managers timely awareness of the overall situation.
Putting the system into practice was exceedingly cost-effective too. It took less than $100,000 to implement, including initial payments for licensing, devices, and other equipment.
And, as Ervin points out, the payoffs for being able to restore power more quickly exceed the monetary benefits.
“Imagine the cost savings in a storm like Sandy if you can leverage technology to get the power on one day faster,” she said. “The payoff is also increased customer satisfaction and improved municipal relations.”

