Insurance Company Uses GIS to Prepare Maps and Data to Better Serve Customers
The 2012 hurricane season was unfolding as a relatively mild one—that is, until Hurricane Sandy hit. The eighteenth named storm of the year, Sandy was a category 3 storm at its peak intensity when it made initial landfall in Cuba. While the storm may have been downgraded to an extratropical system before it made its second landfall, it still packed a major punch for the northeastern United States. At 900 miles across, Sandy was the largest Atlantic hurricane on record, causing damage across 16 different states in the Northeast.
Total economic damage estimates are assessed at up to $50 billion according to EQECAT, a catastrophe risk-modeling firm. The severe damage from the storm, along with strong storm surges, severe flooding, and wind damage, earned it the name Superstorm Sandy. The Insurance Information Institute reports that insurers will pay an estimated $18.8 billion in claims to policyholders.

For Amica Mutual Insurance Company, the response to Superstorm Sandy began well before the storm made landfall. Amica, a provider of personal insurance for autos, homes, and boats, has a reputation of providing excellent service to its policyholders.
Real-Time Monitoring Makes the Difference
What made this event different from previous large-scale disasters was the widespread use of digital mapping and technology from Esri. Prior to the storm making landfall, the company visually analyzed exposure using the Esri-based public information mapping feeds for hurricanes via the web, as well as select data feeds from the National Oceanic and Atmospheric Administration (NOAA) NowCoast services.
The company used the Esri data feeds to continually monitor the latest National Hurricane Center (NHC) forecasts. “We were able to track how our exposure changed, in real time, as each update from the NHC was released,” says Adam J. Kostecki, manager at Amica. With forecast updates released every few hours, the data feeds provided by Esri make monitoring the storms much easier.
Amica used its own Hurricane Viewer to identify which policyholders would receive prestorm alerts. Using this location-based data, the company sent e-mails to hundreds of thousands of policyholders in advance of the storm. When the storm made landfall on October 29, they began monitoring the storm’s impact using live mapped data, plotting claims in real time to identify areas where claim volume was most significant. This helped Amica identify the hardest-hit areas and allowed it to dedicate its more experienced adjusters to those claims.
“Days into the event, we were able to accurately predict the number of claims we would eventually see in the areas inundated by storm surge.” says Kostecki. “This allowed us to make better decisions on the number of adjusters we would eventually need for these inspections.”
Helping at a Local Level
While Superstorm Sandy was a huge storm that affected a widespread area, it also caused some highly localized areas of damage. For example, a neighborhood in Breezy Point, New York, was not only affected by storm surge but also suffered a large fire that destroyed over 100 homes. Amica was able to quickly identify whether or not it had policies in this area.

“When we learned of the fire, we proactively contacted our policyholders on the peninsula,” says Kostecki. “We even reached an out-of-state policyholder who had no idea their secondary home wa at risk of burning. Thankfully, their home was spared—but they appreciated that we were watching out for them.”
A Speedy Timeline
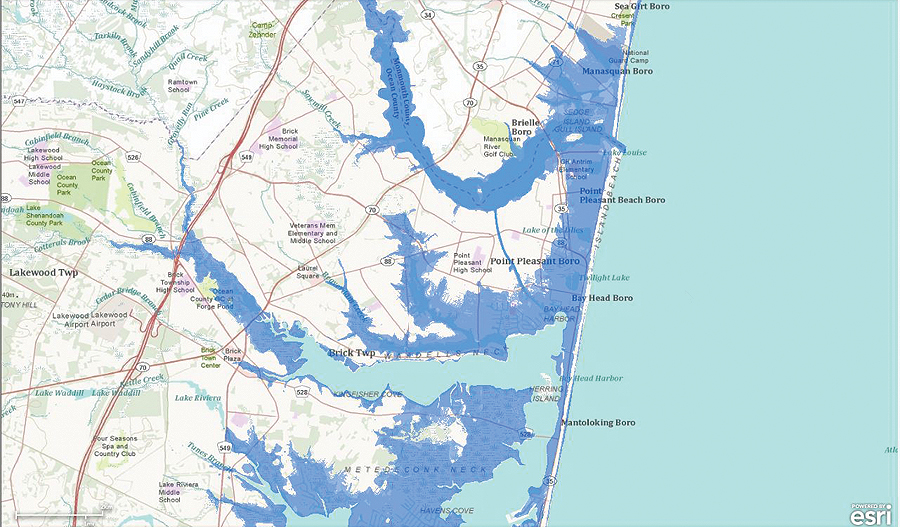
Amica went quickly from discovering map and data services to publishing maps that all claims managers could use. First, Amica discovered the NOAA digital Esri-based map services available on arcgis.com. Staff used the NOAA Sea, Lake, and Overland Surges from Hurricanes (SLOSH) model to identify policies and claims in the areas likely to have been inundated by storm surge. The SLOSH model is made up of a set of calculations that are used to understand the estimated heights that can be expected at various points along the shoreline. Atmospheric pressure, size, forward speed, and track data are all taken into account to create a model of the hurricane’s wind field, which is what drives the storm surge.
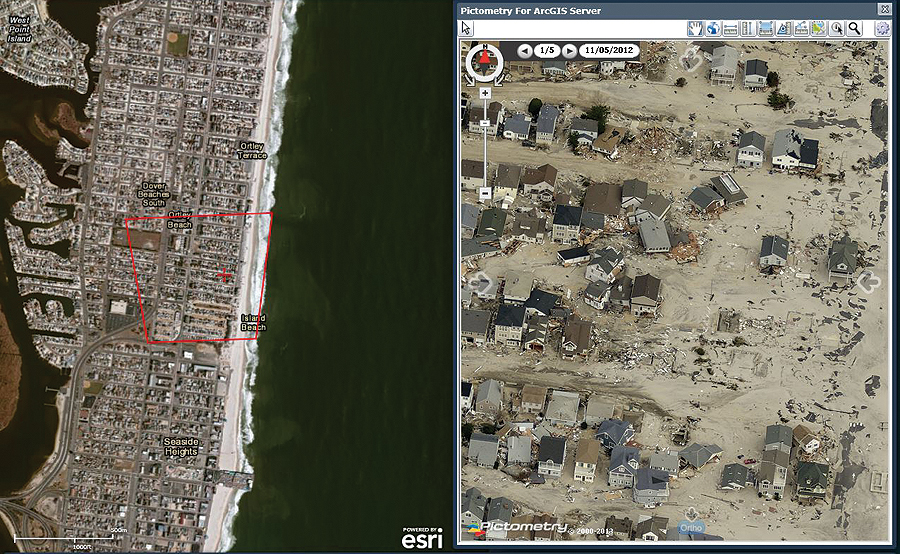
Then Amica incorporated a NOAA postdisaster imagery service to identify the extent of damage in areas where access was limited. Postevent imagery from Esri Silver Tier Partner Pictometry of Rochester, New York, was also included to provide an incredibly detailed aerial view of the damage from the storm. The Pictometry data helped document damage shortly after the storm passed, which was useful in cases where repairs had been completed prior to the adjuster’s inspection. It was also used to document minor exterior losses, like downed fences, enabling claims to be settled without an adjuster’s inspection.
Amica also provided its own specific map layers that included claims/policies, outside adjuster territories, and more. Then, Amica’s digital map was published to all claims managers and claims supervisors in the company.
From Reactive to Proactive
Major catastrophes will always be a challenge to respond to, especially those that affect a wide area like Superstorm Sandy did. Each event is different and poses unique problems to overcome. Whether it involved contacting policyholders before the storm made landfall or identifying claims that should be closely monitored until conclusion, Amica’s use of GIS technology and real-time data enabled it to make more informed decisions during all phases of the response—which is critical with any catastrophe.
“With past events, we would often find ourselves in a reactive position,” says Mike Gillerlane, senior assistant vice president and head of the Property Loss Division at Amica. “Maps with real-time information provide us with a better overall view of the event and allow us to be more proactive.”
For more information, contact Adam Kostecki, manager, Amica.

