A Deeper Look at Recent Improvements to ArcGIS Online
With each new release, ArcGIS Online gains advanced capabilities and fresh content. Thanks to input from users about what they need most from the technology, Esri’s team of developers is able to continually infuse ArcGIS Online with improvements that make it easier to use and simpler to navigate.
Dive a bit deeper into some of the more recent improvements to ArcGIS Online and see what this integral part of the ArcGIS platform is capable of.
New Capabilities

Three new features in Scene Viewer bring 3D scenes to the next level.
First, a new elevation mode, called Relative to scene, automatically selects the highest position of all layers to ensure that users can clearly see points that overlap with objects. For example, in a web-based tourist scene that has both a 3D building layer and point layers that mark popular tourist locations, using the Relative to scene elevation mode will place the points on top of the buildings so they show up cleanly.
The second feature is the Callout option, which lifts icons above the buildings they mark and draws a vertical callout line below to help users identify exactly which location an icon refers to. This can be especially helpful for points that are located on the ground between buildings, since they would otherwise be occluded.
Third is the new Declutter setting. For scenes that have many overlapping points, it automatically cleans things up by hiding point layers that overlap. For example, a scene of art galleries in New York City would be littered with overlapping points, since there are so many of them and a lot of them are located close together. Using the Declutter setting, however, provides a clean viewing experience, as fewer points are showcased on the full scene. When a user zooms in to a specific area, though, all points become visible.
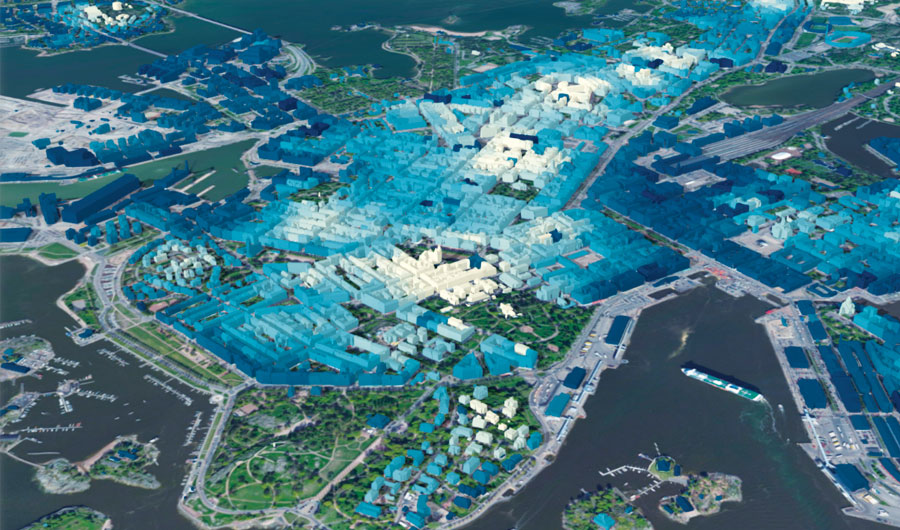
Smart mapping has new 3D capabilities within Scene Viewer as well. Users can now stylize buildings with colored and gray-scale textures, use the Counts & Amounts style to drive color ramps (showing energy use from high to low, for example, with dark blue indicating high use and light blue signifying low use), and employ the types style to assign a different icon or symbol to each attribute value (a green circle to indicate parks and a purple square to signify commercial buildings, for instance).
Users can also now create hosted feature layer views to generate multiple views of their data—with different styling, sharing, and editing permissions—without having to duplicate their data. It is also possible for users to define what data is visible by creating a view definition based on features or fields.
Map Viewer now makes it easier to run the same (or similar) analysis over and over. It automatically saves analysis input parameters in the results layer, so users can just click the new Rerun Analysis button to update the analysis with the most recent data. The button also works to keep live data feeds current. Just update the input layer before clicking it, and everything stays up-to-date. Additionally, users can employ the Rerun Analysis function to share the steps of an analysis along with the result. When others receive the dataset, they can use the Rerun Analysis button to open the tool pane, view the parameters used to create the result, and rerun the analysis themselves.

The Esri World Geocoding Service, which has exceptional coverage, accuracy, and flexibility, now supports address-level geocoding in 135 countries. In addition, the reference data for most countries has been updated, and new, authoritative address data sources were added for Australia (from PSMA Australia’s Geocoded National Address File, or G-NAF) and Austria (from BEV, the Federal Office of Metrology and Surveying).
Now, even poorly formatted addresses can yield the correct match. For example, the Esri World Geocoding Service can decipher most misspellings, as well as extra, non-location-based information (such as a homeowner’s name) and identify the appropriate coordinates.
Distributed Collaboration
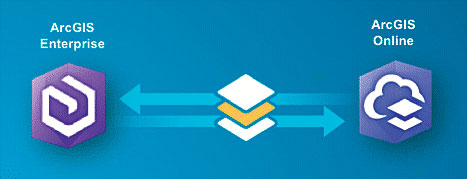
Working together just got a whole lot easier. As part of an early adopter program, users can now share content between their ArcGIS Online organizations and ArcGIS Enterprise 10.5.1 portals. These new distributed collaboration capabilities in ArcGIS Online allow organizations working in both online and on-premises systems to establish a trusted environment with defined rules for sharing maps, layers, and files. The data stays in sync using item and data replication.
Improved Navigation
To help users who have multiple accounts for ArcGIS Online and Esri websites, Esri introduced Switch Accounts, which links them. Now, it is easier to toggle among ArcGIS Online accounts and Esri websites, including My Esri, Technical Support, and GeoNet. ArcGIS Online accounts that use the same login (a social or enterprise login, for example) are automatically linked with Switch Accounts, whereas ArcGIS Online accounts with different logins allow users to link their accounts from the Switch Accounts panel. With this, users can stay signed in, choose to sign out of the current account, or opt to sign out of every linked account—all in one place. The contents and privileges associated with each account remain independent and separate, completely unaffected by the linking.
Users can also launch web apps directly from ArcGIS Online by clicking the Apps button on the right-hand side of the header on the home page. Once an app is selected, it will open in a new browser tab. Additionally, when users sign out of ArcGIS Online in one tab, they automatically get signed out of ArcGIS instances open in other tabs.
More Content
Even with the profusion of feature layers, apps, and basemaps already available in ArcGIS Online, Esri keeps adding more.
The Living Atlas of the World contains two new basemaps: World Imagery (Firefly) and World Imagery (Clarity). Currently in beta, these are both alternative views of the World Imagery basemap.
The Firefly basemap is dark and desaturated to ensure that the data presented on top of it pops. It is best paired with a single, glowing thematic layer to easily capture a viewer’s interest on a focused topic, such as weather phenomena, which benefits from the drama and spatial context of imagery but is sometimes better represented by reduced-color imagery.

The Clarity basemap is intended to be used when it is more important to get a clear view of a place than to present the most recent imagery of that location (the latter being the default for World Imagery). For instance, if the most up-to-date imagery of New York City has a cloud over Times Square, but a user really needs to show the streets that make up Times Square, he or she could employ the Clarity basemap to get a slightly older version of the imagery that doesn’t contain the clouds.
The World Imagery basemap has a wealth of new content as well. Thanks to Esri’s ongoing partnership with DigitalGlobe, developers have been able to update the World Imagery basemap with new high-resolution imagery for Afghanistan, Alaska, Austria, Canada, Colombia, Germany, the Netherlands, New Zealand, Spain, Suriname, Turkey, and other places. Several dozen metro areas have also been updated with submeter-resolution imagery. Esri has improved its demographic maps for the United States and a number of other countries as well. For the United States, Esri’s demographic maps now feature the latest 2017 current-year estimates and 2022 five-year forecasts based on census and American Community Survey (ACS) data. Esri partner Michael Bauer Research has also released updates for more than 30 countries, including China, India, Japan, Kazakhstan, Israel, and the United Arab Emirates. Additionally, the 2010 US Census demographic data is available for free in the Living Atlas of the World.
For more information about what’s new in ArcGIS Online, visit the ArcGIS Online blog. Esri also invites all users to share their product enhancement ideas.