In the agriculture industry, efficiencies (and profits) are often influenced by the distance between the farm and various assets—how far away is the nearest feedlot, grain elevator, or crop nutrient facility?
In the early days of farming in the United States, when many facilities were built, transportation wasn’t as efficient as it is today. So grain elevators were set up in locations that farmers could reach via horse-drawn carts over the course of their workday. Later, these storage facilities were built in locations that could be served by railroads. Today, semitrucks provide greater flexibility in transporting grain, feed, and other agricultural commodities. However, existing storage facilities are sometimes located in suboptimal areas to serve the farms’ current customers, and new facilities are often built on the same footprints as the ones they replace without taking into consideration more strategic locations.
The Land O’Lakes agricultural cooperative was founded nearly 100 years ago by 320 creameries to improve the quality, consistency, marketing, and economics of its dairy products. Today, it is one of the largest co-ops in the United States and is composed of about 4,000 members and more than 10,000 employees. Its industries include dairy products, animal feed, and crop inputs and insights. Sales total $13–$15 billion per year.
About six years ago, the co-op formed a Strategic Asset Management (SAM) team, a consulting group within Land O’Lakes that provides services to the company’s ag retail-owners. The team has used GIS technology from the beginning.
The Geographic Dynamics of Business
Land O’Lakes employs GIS in three distinct ways. First, the SAM team uses geospatial technology for the consulting projects it conducts for co-op members, providing them with insights and solutions for their businesses.
“We show them mapping and locational information about the trade areas for [a] project—where the trade area is, where their facilities are within the trade area, and where the competitors are located,” said Josie Taylor, the SAM team’s consulting manager. “This allows us to visually tell them a story about the geographic dynamics of the trade area we are analyzing and how we are thinking about improving it.”
The second way the team uses GIS is for field data collection. “We often need to go out and look at the facilities that the co-ops are running and analyze how they are operating them. What are the capabilities of those facilities? How old are they? Can we expand those facilities?” Taylor said. “We use [Survey123 for ArcGIS] to capture a comprehensive and consistent set of data about the facilities.”

In our consulting practice, we are seeing increased demand for projects that provide long-term solutions in the changing agricultural industry, and GIS is critical in performing the necessary analyses.
The third area in which Land O’Lakes uses GIS is for analytical purposes. As Taylor explained: “If we’ve got multiple facilities that are close together, we analyze where the trade areas overlap. We also perform transportation analysis to determine how products are currently being delivered to our customers and if there is a more efficient way to do it. That’s often about reallocating customers to a specific facility—that is, analyzing the facility they are currently using compared to one that is more appropriate for their use based on distance, functionality, future growth, and so on.”
In addition, Taylor and her team use GIS to explore drive-time routes within specific trade territories, as well as to do some route planning. “But that’s a little bit more on the fringes of what we do,” she said.
Market Analyses Steer New Facility Construction
Agriculture is a dynamic industry that is affected by many factors, including changes in strategic assets, such as the consolidation of existing facilities and the construction of new ones. This can spontaneously create trade area overlaps, gaps, and redundancies, which inevitably impact efficiency.
A big part of facility rationalization is understanding how much capacity an operation has and how much is needed to service existing and future customers. Before building new facilities, the SAM team performs a business assessment to evaluate the project based on the future needs of the marketplace and the potential return on investment. The assessment is based on factors such as the current feed business, customer needs, competitor capabilities, asset efficiency, financial performance, regulatory compliance, market trends, and the risk and exposure of the project.
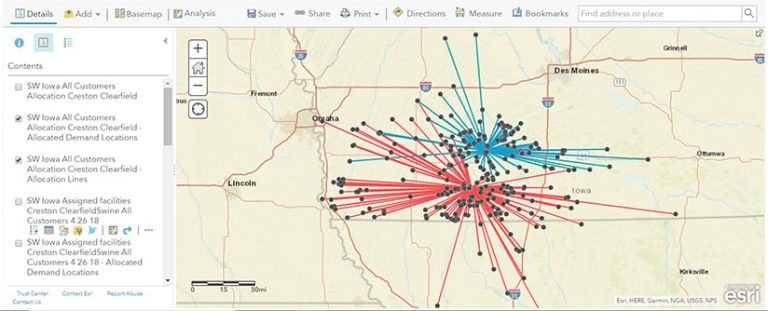
“Another one of the things that our group does is make recommendations to our members about how to change the way that their transportation or distribution model looks,” said Taylor. “For example, suppose you are currently operating seven feed mills for hog producers. Two of those mills are old, and you don’t want to put any more money into them. With some investment, another mill could be operated for an additional five years before you need to replace it. In addition, your market is growing, and you need to increase capacity as the market expands. So the question is, Where is the best place to put a new facility—to replace the three that are outdated—that can manufacture feed in a way that’s more efficient, safer for employees, and implements a tracking mechanism to meet the consumer transparency demands that are needed today? There are a whole host of things that we consider to create greater operational efficiencies in the supply chain for a feed manufacturer, and a transportation study is only one part of the analysis we do to make those recommendations.”
Land O’Lakes also uses transportation studies to examine operating expenses and future transportation costs as part of its financial analysis for capital investment purposes. Questions in this type of analysis include: How many miles do truck drivers have to go today to reach distribution facilities? How many miles would they have to drive if a new transportation model was implemented to accommodate a different set of distribution facilities? And will there ultimately be cost savings, or will costs increase by building new facilities in different areas?
“Other components of our market analyses include an examination of the trends that are happening in an area in terms of where the demand for our products is coming from,” explained Taylor. “Going forward, is that demand changing? Who is driving the demand? How much growth has happened in the market historically? Where are the growth opportunities in the future? Who are the competitors? What are they doing differently than [us], and what is their impact on the market? So we make a recommendation about what should be changed to meet the future needs of an operation.”
GIS Is Critical for Adapting to Change
The SAM team also uses GIS extensively to conduct market and logistics analyses when working on whether or not cooperatives should make large-scale capital investments.
“In our consulting practice, we are seeing increased demand for projects that provide long-term solutions in the changing agricultural industry, and GIS is critical in performing the necessary analyses,” said Taylor.
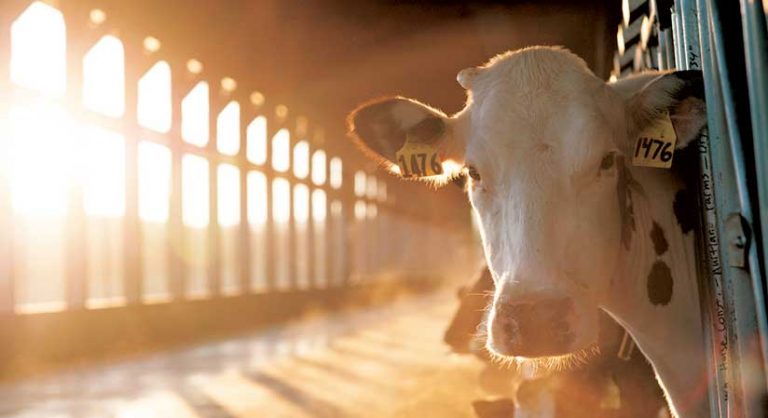
For instance, hog production in the United States is currently driven by a robust demand to export it, and production needs to be efficient. According to Taylor, one of the team’s recent projects—a feed market assessment in Iowa—focused on how to keep up with strong market growth in areas where animal inventories have been increasing by an impressive 5–6 percent annually. Because sale margins are so thin for the feed mills that supply large production facilities, these mills need to create as many efficiencies in the supply chain as possible. The team identified both potential growth opportunities and areas for savings that could be achieved by having the co-ops leverage their current assets.
“During the course of the project, we identified opportunity for business expansion coupled with labor savings of 23 percent and additional operational benefits,” said Taylor. “By using Esri’s ArcGIS Online analysis tools, we were able to identify relative transportation efficiencies for potential sites and make recommendations that improve customer serviceability. This will be realized through new facility construction that promotes sharing the current production load among producers and an efficient reallocation of our customers to existing and new facilities.”
Continuing to Enhance Decision-Making for Long-Term Planning
For the SAM group, the challenge, according to Taylor, is keeping up with retail owners’ business needs and development. GIS helps Land O’Lakes do that by offering different ways to examine how the co-op’s members manage their supply and inventory both in season and out of season. With this data, the team can help them continually hone their operations.
“A lot of our work isn’t about the day-to-day operations of the business. It’s about long-term planning—how…you build out your facilities and make investments in order to keep up with the continual changes in the agricultural market,” said Taylor. “Our goal is to be the adviser of choice for significant retail agricultural business decisions, whether it’s capital or business investments, partnerships, acquisitions, mergers, or achieving the best operational efficiencies.”
