With Custom-Made Web App, Eugene, Oregon, Briskly Coordinates Field Resources.

On the night of December 14, 2016, as an ice storm tore through Eugene, Oregon, the cacophony of fracturing and crashing trees was the call to action for Eric Cariaga, the parks and open space technical specialist for the public works department at the City of Eugene.
“It was apparent early on that this was a dynamic storm,” recalled Cariaga, who has worked at the city for 20 years. “I could tell by the sheer number of failing trees that this was going to be a major tree event.”
Ultimately, more than 3,500 trees were damaged, making it the most catastrophic ice storm Eugene had experienced in almost 55 years. Calls from the public about downed trees and other storm-related problems began flooding the public works department’s phone lines. It was going to require a team of more than 100 staff members from the public works parks and maintenance departments to work together to clean up the mess.
Wanting to maximize efficiency for the 50 field response crews, contractors, and contract managers who were dealing directly with storm cleanup, Cariaga used Web AppBuilder for ArcGIS to create a web-based app—called the 2016 Ice Storm Hazard Tree Response app—that could help emergency management staff in the office map and track the tree hazards. This was then used in conjunction with Collector for ArcGIS to gather data in the field and Operations Dashboard for ArcGIS to keep track of real-time updates.
With chaos unfolding on the streets of Eugene—and 1,700 storm-related work orders needing attention—the calls from the public were recorded in the Maintenance Management System (MMS), a custom-built app that resides in the city’s relational database management system, and then published as map services in ArcGIS Online. The information then had to be scrutinized to ensure that it was accurate and not previously reported.

“It was not too difficult taking the real-time information our dispatchers recorded from the public and creating both the desktop application and the Collector map,” said Cariaga.
He built several layers showing the work orders, field crews’ jurisdictional boundaries, and tree species—which were particularly helpful to know, since deciduous hardwoods are more prone to damage from ice storms than evergreen softwoods. Cariaga implemented the layers into both the tree response app and Collector.
Out in the field, contract managers and specialized tree care professionals, called tree scouts, used Collector to gather data on fallen trees and branches. That information was seamlessly incorporated into ArcGIS Online and distributed immediately to the tree response app and Operations Dashboard. With this wide-reaching GIS, field staff could see updates in real time and managers could keep close tabs on the storm response. Additionally, once field staff cleared a scene, they could use Collector to find the nearest hazard—in real time—that needed to be mitigated.

“This was incredibly valuable for our crews,” said Cariaga. “They could not only see the location of downed trees and limbs, [but] they [also] had a good idea of the damage before they arrived on-scene. In most instances, they knew if they were qualified to respond to a particular call and had the correct tools.”
In the office, the real-time updates from the field were displayed in Operations Dashboard. With constantly changing data coming in, the self-updating charts, gauges, and histograms helped contract managers, contractors, and emergency command staff gain a holistic view of the tree hazards all over the city. When field crews updated their work orders in Collector, critical information about each hazard was automatically loaded into Operations Dashboard so everyone could see when a work order had been completed and which resources needed to go where next. Having this information available digitally, on one map, was far better than the old, paper-based system in which field staff picked up work orders at the beginning of each week—making it difficult to update the schedule with new information.
In the hours and days following the ice storm, Eugene’s public works staff investigated more than 1,200 calls from the community regarding tree hazards. Branches hung dangerously over streets and in parks, and recording and mitigating the damage was an enormous task.
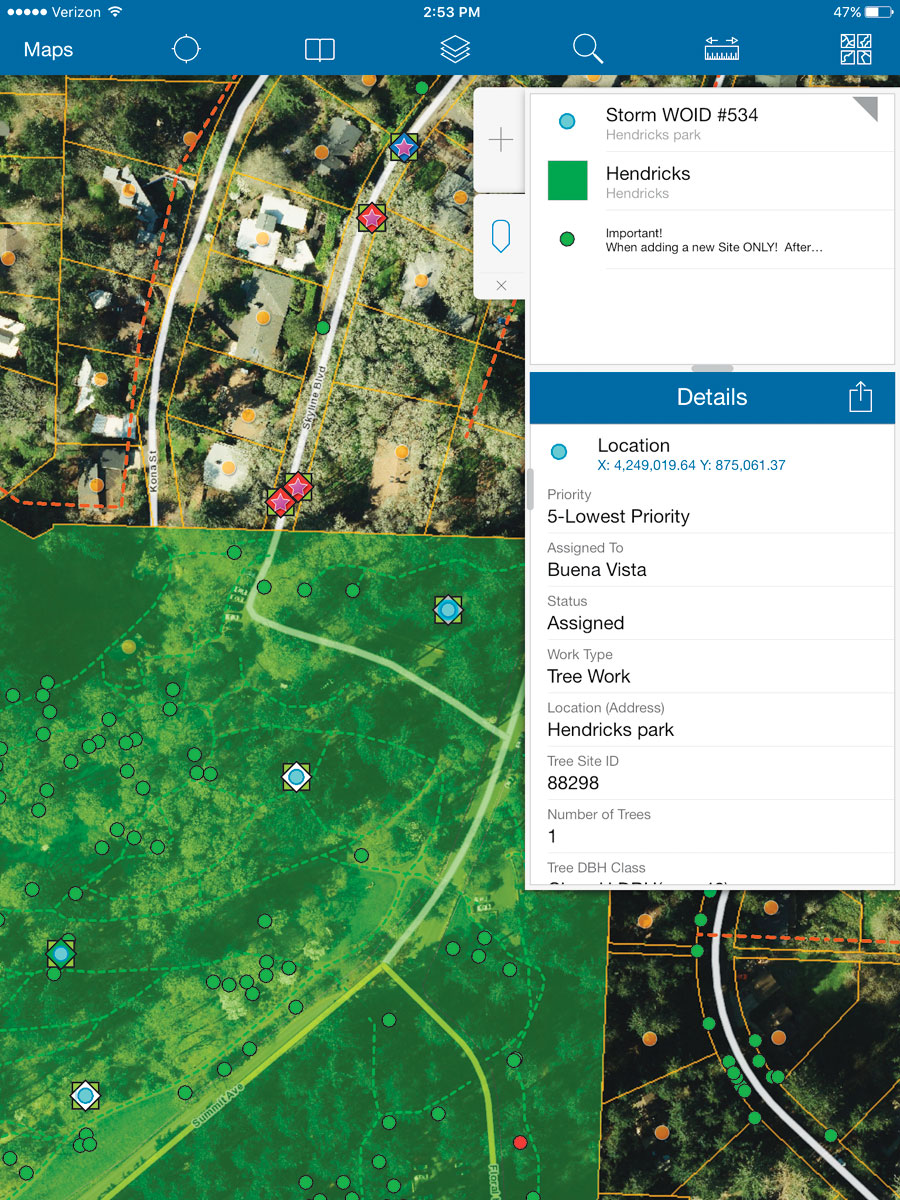
The highly skilled tree scouts continued to work methodically throughout the city. First, they canvassed priority routes—high-traffic roadways and areas where there was more of a chance that falling trees could damage property or injure the public. They then branched out to other areas of the city, eventually evaluating every street, park, and trail in Eugene. At each spot, they recorded tree-related hazards in Collector. Details included the severity of the hazardous conditions, coordinates, and photos.
With all this data available in ArcGIS Online, Collector, and Operations Dashboard, technical staff in the City of Eugene’s parks and open space department were able to document, understand, and analyze the hazards—determining hot spots of storm-related destruction, figuring out which tree species were most susceptible to ice storm damage, calculating the average number of hazards each response team mitigated per day, and more. It also saved Eugene time when working with the Federal Emergency Management Agency (FEMA) to apply for reimbursement for storm cleanup and other related costs.
“This storm response was by far the best I’ve ever seen in my time at the City of Eugene,” said Cariaga. “We were able to respond to calls quicker and with increased accuracy and efficiency.”
While the City of Eugene continues to implement GIS technology in more areas of service—from tracking maintenance activities to maintaining and updating park assets—Cariaga doesn’t want to lose sight of the most important portion of the response: the men and women who work out in the field. They spent weeks identifying and clearing tree hazards—removing downed trees and branches from the entire right-of-way street system, which includes all publicly owned streets.
“They truly [were] the stars of this recovery process,” said Cariaga. “Without our field staff willing to go out in the rain, snow, or freezing temperatures, none of this would be possible.”
For more information about this project, email Brian Richardson, the City of Eugene’s public works public affairs manager, or call 541-682-5523.