Where and how should a community grow? Where should the city build sidewalks and trails to lower the risk of accidents and encourage walking? What areas should be preserved as green infrastructure? How far do residents have to walk or drive to reach a public park?

These are the questions urban planners around the world face every day. And the answers are out there, thanks to the increasing availability of open and proprietary data and the growing use of geodesign technologies, such as GIS, that make sense of the data.
Smart community planning is powered by the ability to analyze and visualize data on maps, including in high-resolution 3D city models. This smart, data-driven approach to planning was one of the major topics discussed at the 2017 Geodesign Summit.
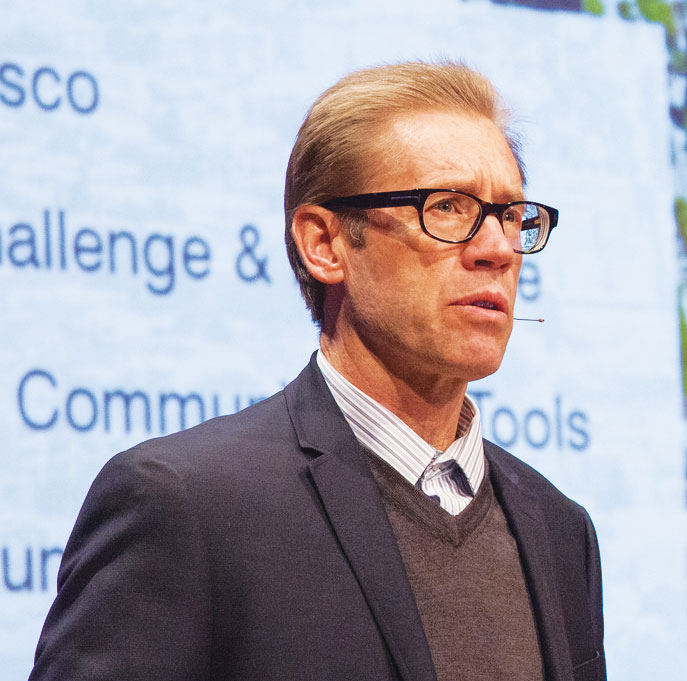
“Data is everywhere and can be collected from everywhere, including from individuals walking around with cell phones,” said summit moderator Stephen Goldsmith, speaking to more than 220 planning directors, urban planners, architects, engineers, GIS professionals, and academics. The group met for a series of workshops and presentations at the end of January at Esri headquarters in Redlands, California.
“[With] this massive amount of data, we need context,” continued Goldsmith, a professor at Harvard University’s Kennedy School of Government and the former mayor of Indianapolis, Indiana. “GIS is an organizing context for data.”
Esri president Jack Dangermond, who had just returned from a trip to India, where he inaugurated a GIS Innovation Hub in Hyderabad, said that that country is embracing the idea of data-driven smart cities faster than in some areas of the United States. He said that digital technology is everywhere in India, from “tiny rural villages to growing metropolises.”
Every person who walks around with a mobile phone is a potential sensor or collector of real-time data that, once analyzed and visualized, can be used to make decisions and improve how a community functions.
Real-time data collection using sensors and the Internet of Things (IoT)—coupled with advanced spatial analytics and visualization of big data, or “smart GIS”—will help drive problem solving, Dangermond said. And there are big problems to solve, including climate change, loss of nature, and loss of biodiversity.
“These are problems we are going to face for the rest of our lives, [so] we need to collaborate and work together,” said Dangermond. “GIS and geodesign represent a framework and process for creating a smarter world.”
Smart Urban Planning
Creating a smarter world starts with smart planning. That’s where geodesign comes in.
Geodesign combines the art of design with the science of geography in the planning process. Stakeholders provide input, and geodesign practitioners then use creative design techniques, rigorous methodologies, spatial analysis, and mapping to find the most suitable sites for housing developments, parks, office space, transit, and renewable energy projects.
All government organizations, from small municipalities to major cities, face vexing planning issues that often revolve around questions of where and how to grow while still maintaining the unique character of the community. To study those issues, some cities, such as San Francisco, California, and Boulder, Colorado, are beginning to use 3D geodesign technologies.
Scott T. Edmondson, a strategic sustainability planner-economist for the San Francisco Planning Department, said that as the City of San Francisco studies how to grow, it is beginning to use 3D GIS technology. He showed the summit audience how city planning staff and an Esri team used 3D GIS tools to analyze and visualize data on height control of buildings, housing and jobs capacity, housing and jobs growth, and transit access to housing and jobs.
Edmondson said that the city typically employs tools such as 2D maps, Microsoft Excel tables, and charts to communicate planning scenarios. However, the 3D tools and techniques used for the demonstration project provided a “better visual explanation” of the data, he said. “People get it quickly.”
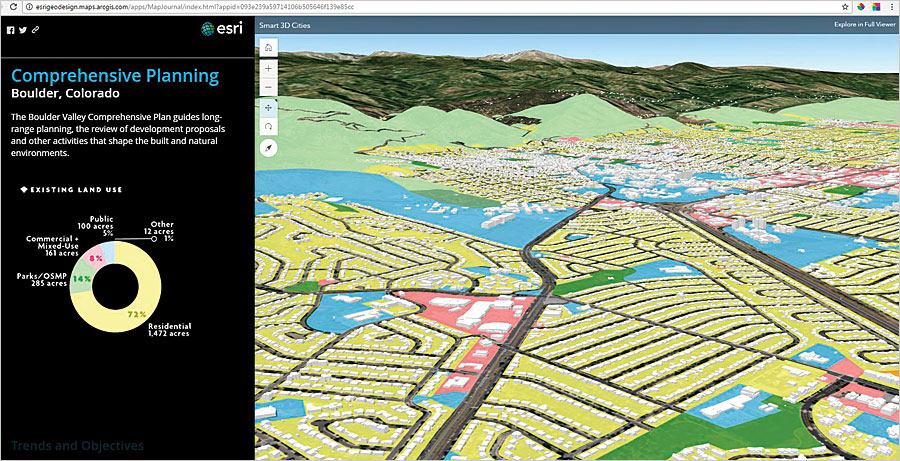
In Boulder, Colorado, work is under way to update the Boulder Valley Comprehensive Plan, a long-range planning guide for the community, which has 107,000 people and 100,000 jobs. The city’s comprehensive planning manager, Lesli Kunkle Ellis, told the audience that the city is expected to grow rapidly in the next four to five years. While job growth is strong, however, the availability of affordable housing lags.
To study and communicate data and issues related to land use, the City of Boulder has used a range of Esri technology, including Esri CityEngine 3D modeling software and Esri Story Maps apps. The maps show, for example, what percentage of land in the Boulder area is currently residential (72 percent); commercial and mixed use (8 percent); parks, open space, and mountain parks (14 percent); publicly owned (5 percent); and other (1 percent). The Boulder Valley Comprehensive Plan Story Maps include 3D maps of subcommunities with layers that, when turned on, show wetland areas, bike lanes and pedestrian trails, sidewalks, transit routes, parks and open space, zoning districts, and capital improvement projects.
Ellis said Boulder residents are very interested and engaged in the planning process. To give the public the opportunity to explore the land-use data, the city put the story maps on its website.
“The story maps are a fantastic tool,” said Ellis. The city would like to create more.

Kenton County, Kentucky, also uses GIS maps to research issues and communicate with the public. Trisha Brush, GIS director, and Emi Randall, director of planning for Kenton County’s Planning and Development Services (PDS), told summit attendees about LINK-GIS, an information portal that lets people explore a wide selection of online maps.
Brush and Randall also talked about Northern Kentucky Map Lab (NKYmapLAB), a PDS initiative in which data is analyzed to produce story maps that inform and solicit feedback from the public and elected officials about various issues—some of which are connected to Direction 2030, the county’s long-range plan.
PDS has created story maps on topics such as walkability and sidewalk connectivity, traffic congestion, the urban tree canopy, solar potential, and a plan to widen a state highway in northern Kentucky.
“If a picture is worth a thousand words, a map is worth a million,” Brush said.
Brush and Randall’s presentation also included the PLAN4Health in Kenton County story map, which shows the results of an analysis done to identify food deserts—areas of a community that lack easy access to healthy foods, such as fruits and vegetables. The American Planning Association (APA) funded the project to conduct the analysis and supports a program to educate people about nutritious foods and bring more healthy foods into corner grocery stores.
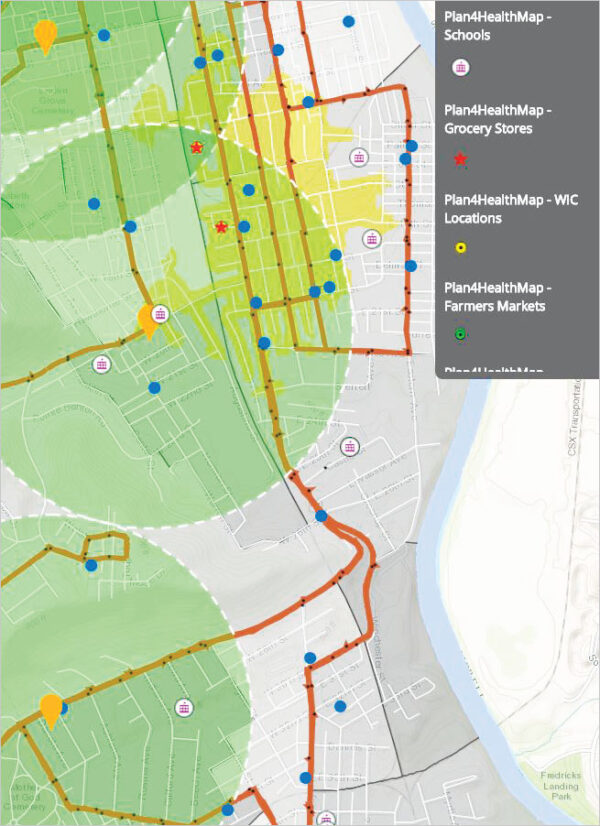
One program participant was Kimmy’s Korner, a neighborhood corner grocery store in Covington, Kentucky.
“The owner, Mark, wanted to help kids eat healthier,” Randall said.
With the help of new refrigeration equipment, he added apples, oranges, yogurt, fresh vegetables, and sweet potatoes to his shelves.
Learning Technology, Planning Communities, Telling Stories
The Kenton County PLAN4Health project, along with its story map, serves as a good example of what James M. Drinan, APA’s executive director, calls “Place-making as Storytelling,” the title of his Geodesign Summit talk.
Urban planners need expertise in both design technology—including geodesign—and storytelling, Drinan said. He believes that planners need to educate themselves about the latest technology available to gather and communicate stories about a place, which is important in the design process.
“Technology is not just a tool but a compelling requirement that planners must master,” he said. “Otherwise, we risk irrelevancy. We risk being left behind.”
While data is important in planning, so are stories, according to Drinan. Planners need to gather people’s perspectives, or stories, about issues to create plans for the community’s well-being, he said.
“As planners, we need to listen to the stories that people tell [us],” Drinan advised. “I want to start by understanding everyone’s perspective. I need to ask questions and get information from them.”
Stories carry weight and can be used to better explain a plan than data alone, said Drinan. For example, a story can illustrate how straightening a road and adding lighting to an area will keep bike-riding children safer.
“Storytelling humanizes the data,” continued Drinan.
That’s why he thinks that using technology such as Esri Story Maps apps is so helpful. Drinan pointed to the PLAN4Health in Kenton County story map as an example. The story map includes
- Interactive maps of neighborhoods that are within easy walking distance of or have mass transit service to grocery stores.
- Profiles of some of the stores that participate in the Covington Healthy Store Corner Program.
- Educational information on what types of foods to eat to stay healthy.
“We don’t just need to tell stories; we also need to link place-making to the public good,” Drinan said.
And to improve people’s lives in this digital age, planners need to embrace new technologies.
“If we don’t take advantage of new technology, we risk losing our audience,” he concluded.