You can use animated GIFs as custom point symbols for maps in ArcGIS Online.
Of the many image formats available (JPG, PNG, BMP), the GIF, or Graphics Interchange Format, is the one we can use for animated symbols. GIF files support multiple frames. That’s why they appear animated. By spacing out the timing of multiple images, a GIF comes to life.
So how is this done? The process is easy:
- Find or create the GIF you want.
- Host the GIF.
- Use it as your point symbol.
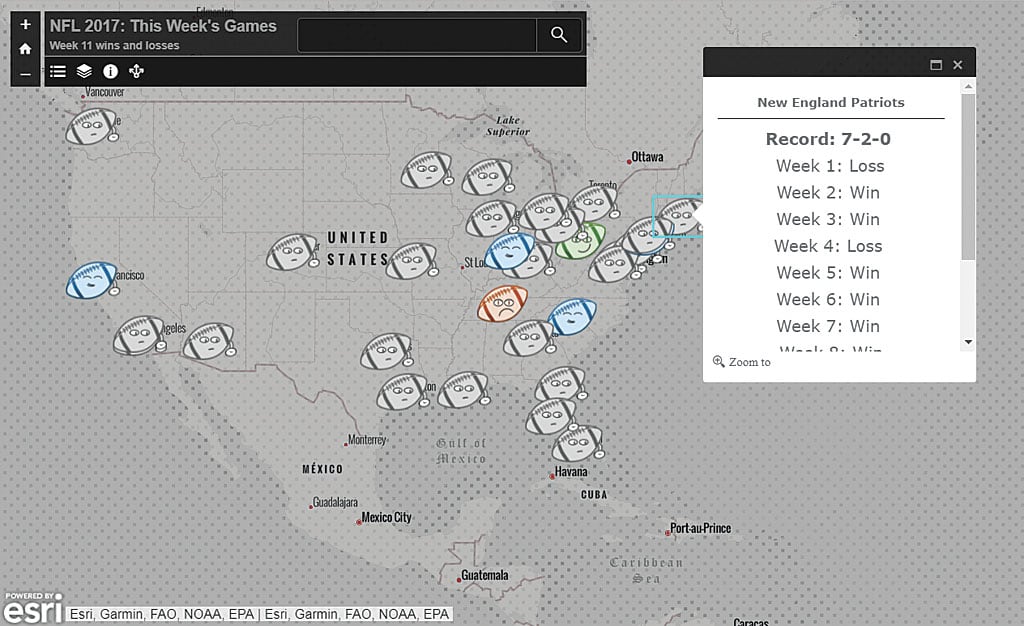
An example of animated GIFs in action is the map I created showing the wins and losses of NFL teams in 2017. The football symbols show week-by-week wins and losses for each NFL team. Winning teams smile with pride, losing teams cry with shame, and teams with bye weeks rest.
Since I don’t have Adobe Photoshop, I created these symbols using Microsoft PowerPoint. I used basic shapes, curves, and ovals to create the little football faces. For each emotion, I created two versions of the facial expression and saved each one as its own image. Then I used ezgif.com, a free online animated GIF maker and editor, to transform the two images into a moving animation.

The key to creating your own animated GIFs is to make sure the background of each image is transparent. If you don’t, you will get a white box around your final GIF. Avoid this by saving each image in PNG format to preserve transparency.
Once your GIF is created, just use it as a custom image for your point symbol. You will need a URL for the image. I use imgur.com to host my GIFs because it is free and easy to use, but there are many options: Flickr, Dropbox, Google Photos, TinyPic, and many others. Once your GIF is hosted, use the URL for the image as your point symbol in ArcGIS Online. Make sure the URL contains the file extension .gif.
Have fun with this technique, but not too much fun. Don’t create too much movement on the map or your audience will get dizzy. Keep it simple and use animation to emphasize a specific action or event.
Happy mapping!