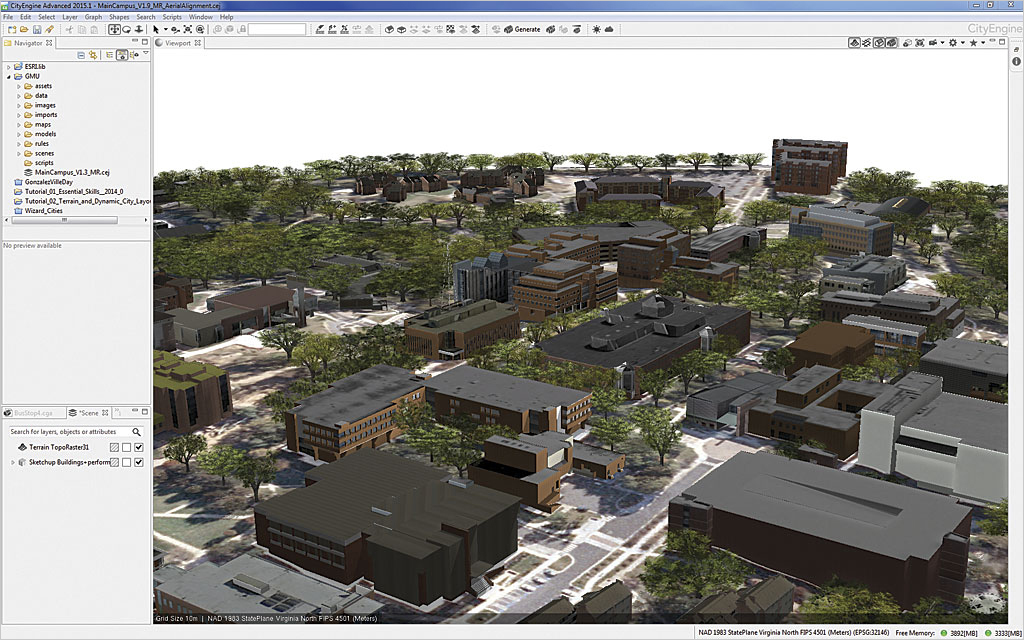
This article describes the workflow used to create a 3D campus scene of George Mason University that can be displayed using CityEngine Web Scene. This workflow required ArcGIS for Desktop, the ArcGIS 3D Analyst extension, and Esri CityEngine.
The web scene was created by Zhihang (Steven) Li, Michael Rodriguez, and Alec Zhang, who are students at Thomas Jefferson High School for Science and Technology. They were working on a special project under the guidance of Dr. Sven Fuhrmann, associate professor of Geovisualization and Geoinformation Science (GGS) at George Mason University, and Michael Piccione, faculty at Thomas Jefferson working on a grant with the GGS department. View the George Mason University campus web scene.
Workflow Overview
The first step in the process was the generation of a campus elevation model. A labeled raster image file was created so it could be draped over the model. At this point, 3D roads and sidewalks were generated and imported into Esri CityEngine. Finally, buildings were either imported or created, trees imported or generated, and thematic data symbolized.
Importing a TIN File into CityEngine
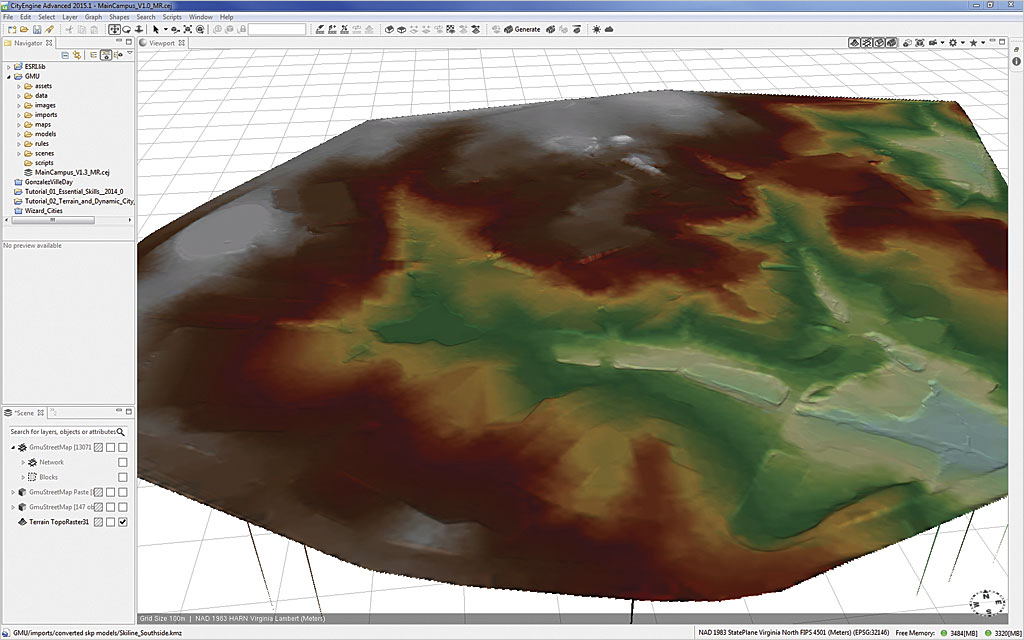
A triangular irregular network (TIN) file represents a surface and is often used to visualize terrain information. A TIN was used for the base elevation data for the campus area, but several other elevation data options would also have worked. A TIN for Fairfax County was acquired and clipped to the area of George Mason University.
To prepare the TIN for CityEngine, it was opened in ArcMap, and the TIN To Raster tool (in the 3D Analyst toolbox) was used to convert the TIN to a raster. The Sampling Distance option used should be a cell size of less than 10 meters, and 3 to 4 meters is preferable. After opening the output raster, it was exported as a TIFF to the CityEngine workspace. The TIFF was dragged into CityEngine as a terrain layer.
Creating an Overlay Image
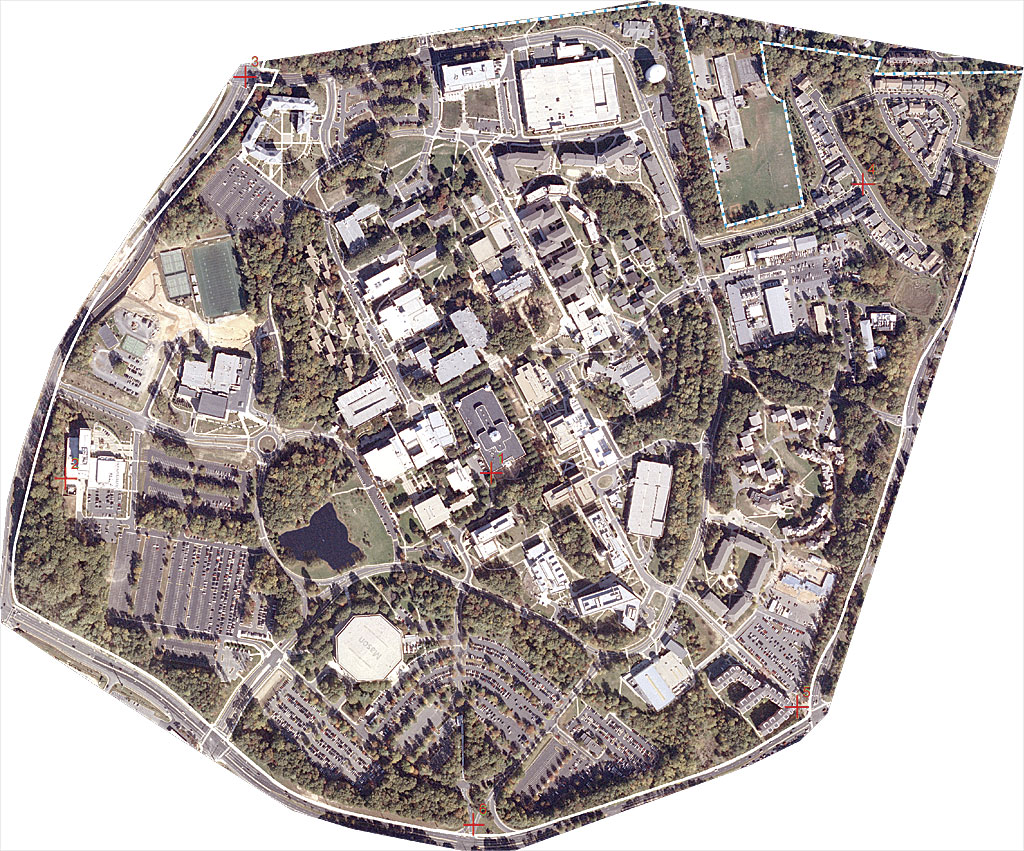
Once the elevation model is generated, it is usually draped over with an air photo. CityEngine supports image overlays on terrain data. It is advisable to make all edits to the image before draping it on the terrain.
In this case, OpenStreetMap (OSM) was used as a basis to develop an overlay image.OSM provides a suitable basis to create an abstract representation of the general infrastructure on university campus, but other image overlay options exist. OSM data matching the extent of the elevation model was exported and converted to an image file with Maperitive 2.0, a free desktop application for drawing maps based on OpenStreetMap and GPS data, and exported as a BMP file at the preferred scale. More than one image can serve as background in CityEngine’s Web Scene if text or other features need to be adjusted for various zoom levels or for visibility reasons.
Overlaying the Georeferenced Raster
To overlay a raster image over the target area, it may need to be georeferenced in ArcGIS first if it doesn’t import correctly into CityEngine. To georeference the raster dataset in ArcGIS, multiple sets of x- and z-coordinates of OSM vertices around the perimeter of the area (such as road intersections) that are common to both the raster and aligned dataset and easily identified were located and recorded.
In ArcGIS, the Georeferencing toolbar was used to place control points first on the raster image and then at the x- and y-target coordinates taken from the OSM data. Depending on the number of points to be georeferenced, first- or second-degree transformation can be used to stretch or bend the raster dataset to better match the target. After the transformation was selected, georeferencing was updated.
Clip the Georeferenced Image
A polygon was created in CityEngine that traced the border of the terrain file. A polyline could also have been used. The x,y coordinates of the polygon nodes were recorded. In ArcMap, the georeferenced image was opened and a polygon drawn using the same coordinates as the border traced in CityEngine. The image was exported with the Using Selected Graphics option so only the image contained within the polygon was exported. This clipped raster file was imported into CityEngine and used as a texture overlay for the terrain.
Importing 3D Models
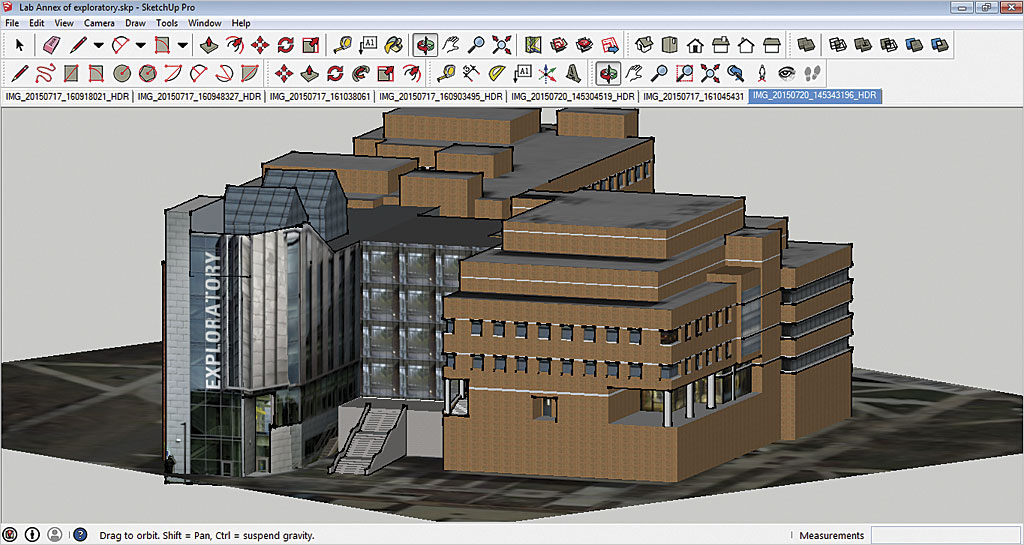
In the campus model, roads and sidewalks could have been created as 3D objects in CityEngine so that they would not be positioned below the terrain. Any kind of 3D object can be imported from various CAD packages or Trimble SketchUp 2015. SketchUp 3D Warehouse (3dwarehouse.sketchup.com) is an excellent source of SketchUp models. For the web scene, several campus buildings that had been previously created were downloaded from 3D Warehouse.
The buildings that were not available in 3D Warehouse were created by team members in SketchUp. The Match Picture feature was used while importing building pictures to draw the building geometries based on photographs. Selected models were imported into SketchUp. In SketchUp, the Georeference tool was used to georeference the file on the map close to the location it would be placed in CityEngine and exported as a KMZ file.
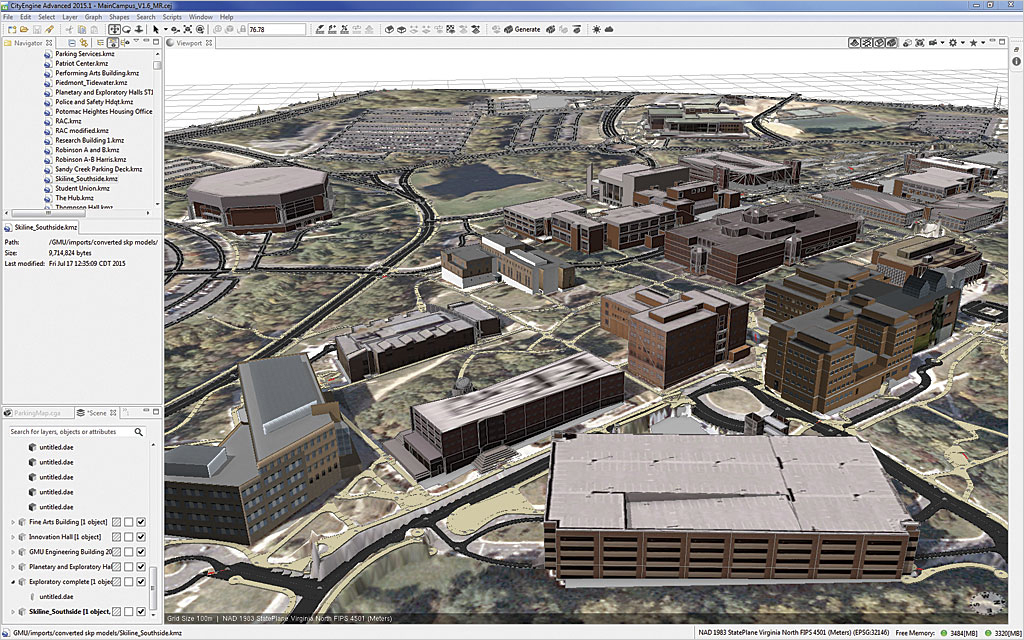
Import Objects into CityEngine
Exported SketchUp and CAD files were moved to a folder in the CityEngine workspace. In CityEngine, the files were imported into the scene as KMZ or DXF files or dragged from the folder in the left browser menu area onto the scene.
If files in the scene didn’t line up correctly, they were moved or copied to the correct location. To reduce the file size and complexity and enable editing of the files using rules, they were converted to shapes using Convert Model To Shape tool in CityEngine. The Clean Up Shape tool was used to simplify the number of vertices.
The problems encountered were related to georeferencing and file size. If the file isn’t georeferenced correctly, it may not import correctly because its coordinates exist outside the extent of the web scene. KMZ files cannot be imported into a scene unless they are georeferenced in the current workspace. Pay attention to the file size. Many models are very detailed and use several megabytes of memory. Importing too many objects into the scene may cause CityEngine to crash.
Creating Buildings in CityEngine
Detailed building models that did not exist were created using rules in CityEngine and building footprints from OSM. Generic shapes can be extruded from the building footprints and features edited by modifying the rendering rules. Generic buildings were generated to match common building styles on campus by using the extrude command (height) and then an appropriate roof command (roofHip, roofPyramid, etc.) and texture application. The texture argument was either a variable associated with a file or an actual file that was referenced. Buildings conform to the building footprint because only solid modeling features are used to extrude them. Most buildings in the scene were imported, but some were created using OSM footprints and facade patterns that were similar to other buildings on campus.
Adding Trees and Vegetation
After placing the buildings, the next process was populating the web scene with trees and vegetation. There are many different ways to do this, but the two methods used were importing trees from the SketchUp 3D Warehouse and generating tree models from an ArcGIS tree point plot. Some 2D trees replaced modeled trees because the scene redraw lagged due to the overall number of trees. Users preferred 2D trees when viewing the artistic rendering but preferred 3D trees in the realistic view.
When only a few trees are needed or when the ideal tree model is not available from the Esri Vegetation Library, obtaining them from the SketchUp 3D Warehouse works well. Desired tree and plant models were selected and imported from the 3D Warehouse into SketchUp. The Georeference tool was used to locate the models on the map close to where they would be placed in CityEngine and exported as KMZ files.
The exported files were moved to a folder in the CityEngine workspace. In CityEngine, the files were imported into the scene as KMZ files or dragged from the folder in the left browser menu area onto the scene. Once a file was in the scene, it was moved or copied by dragging it to the correct location. Tree models were aligned to the terrain using the Align Shapes To Terrain button and the Move tool when necessary. Copies of the tree and plant models were made and dragged to the proper locations.
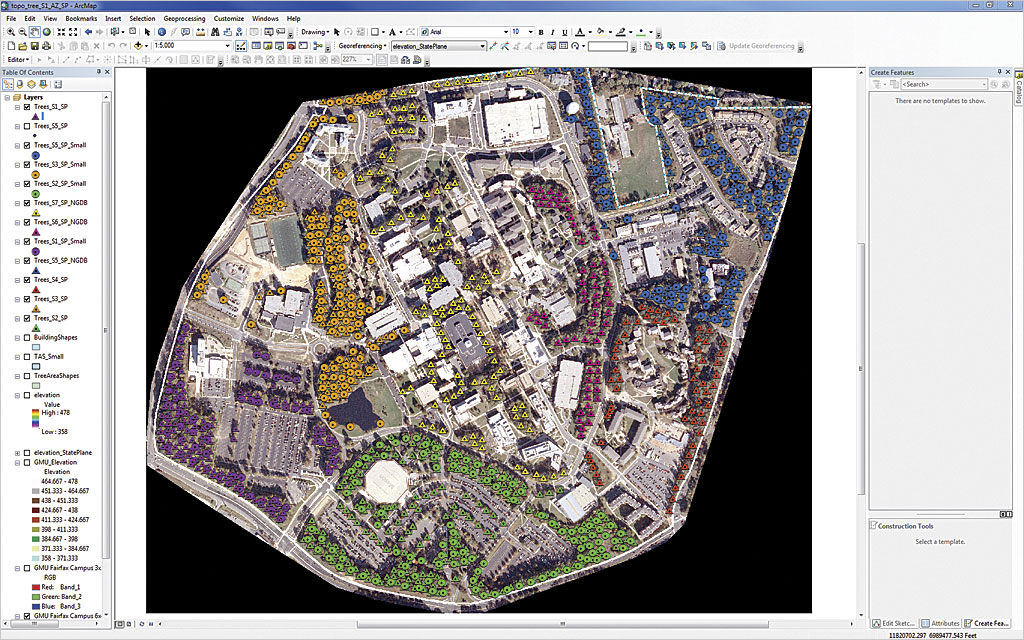
Generating Tree Models from an ArcGIS Tree Point Dataset
If more than a few trees will be used to populate the web scene, generating tree models is more efficient. A new point shapefile was created in ArcCatalog and added to the map document in ArcMap. Using the Editor toolbar, points representing tree locations were added to the map, and the layer was exported as a shapefile.
The tree location shapefile was imported into CityEngine and the tree points aligned to the terrain. A rule file was assigned to the tree points to generate the trees and display them in CityEngine. A comprehensive CGA rule file called Essential_Plant_Loader.cga, containing around 100 different species of trees and three different tree model types, can be found at the Esri website.
Randomizing Tree Species
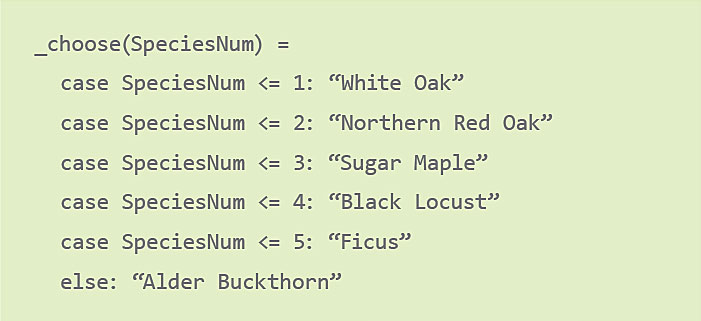
The tree pattern and species selection can be randomized using the plant rule file. The tree species that would be randomized were determined. The size of the set was established as the variable n. A field labeled SpeciesNum was created in the tree shapefile attribute table to store random species numbers. For each point, a random number from 0 to n was assigned. This process was expedited using Microsoft Excel and copying and pasting the resultant numbers into the attribute table. The tree point shapefile containing the SpeciesNum field was exported and imported into CityEngine.
In the CGA file, a function to choose a random tree species based on the SpeciesNum value was created. The choosing species function was called in the naming function set(_plantName, _choose(SpeciesNum)). Tree models were generated using this CGA file so different tree species were dispersed throughout the web scene. Listing 1 shows an example of this function.
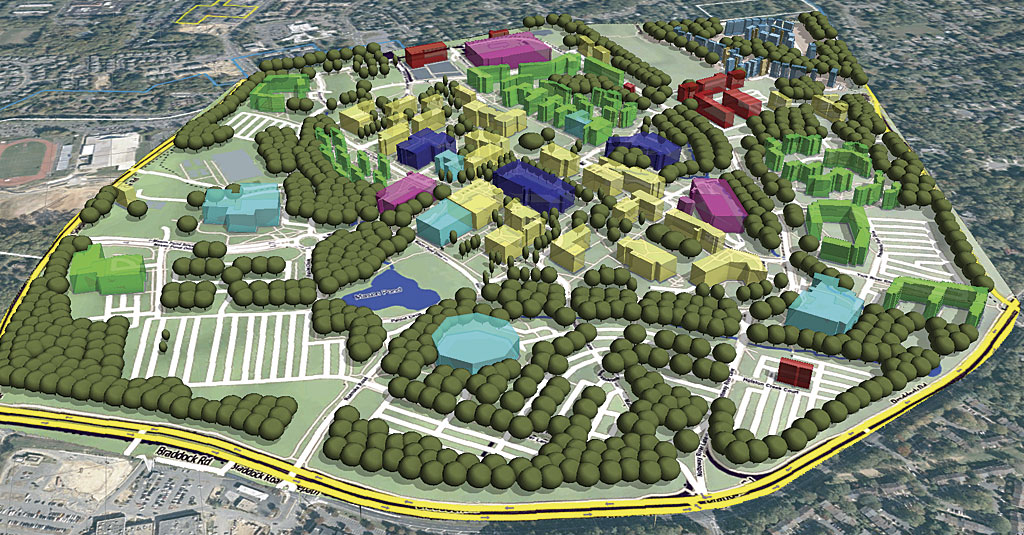
Displaying Web Scenes with Thematic Content
Although campus models often contain building and infrastructure information, thematic data is often not included. Several other datasets were available, so the team explored how to include thematic data. The initial work at GMU focused on building energy usage, building CO2 emissions, and tree CO2 absorptions to generate a representation on environmental impact of energy usage on campus. Building heights were extruded in CityEngine based on energy consumption, creating a thematic three-dimensional web scene. The vertical extrusion approach allows one to display a variety of thematic variables. The team explored the display of categorical and quantitative data.
Campus models don’t need to be photorealistic in all use cases. Often, campus guests want to know the location and use of buildings. CityEngine offers rule files that assign colors for different building uses. While rule files can be written to set the colors of individual buildings, this process quickly becomes tedious with a larger dataset. Since GMU has more than 100 campus buildings, the process was optimized by assigning an extra attribute in ArcMap to the building footprint shape.
Applying color gradients is the technique of transitioning from one color to another based on attribute values. Changes in color gradients can be used to either emphasize specific numerical values or ordinal data. In this case, numerical data was normalized so a gradient could be applied to the normalized values. Numerical values were mapped to values from 0 to 1. The formula, xnormalized = (x – xmin) / (xmax – xmin), can be scaled differently based on preferences (e.g., linear, exponential/logarithmic scaling).
Conclusion
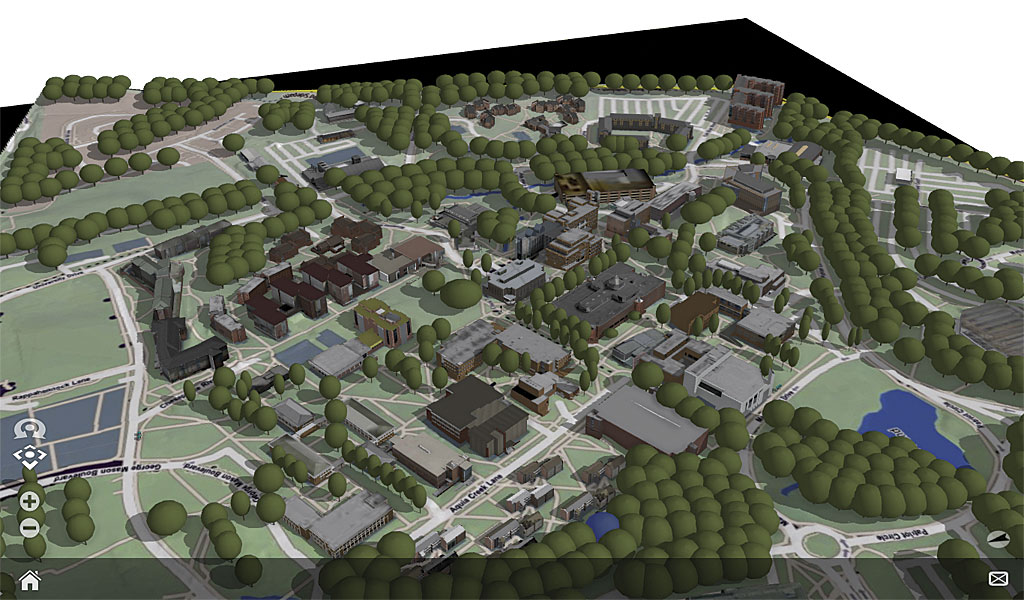
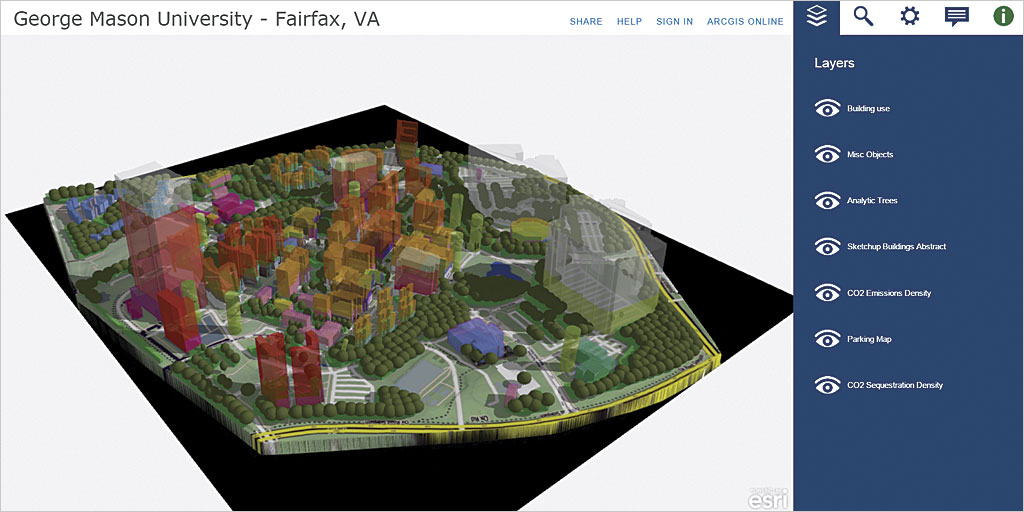
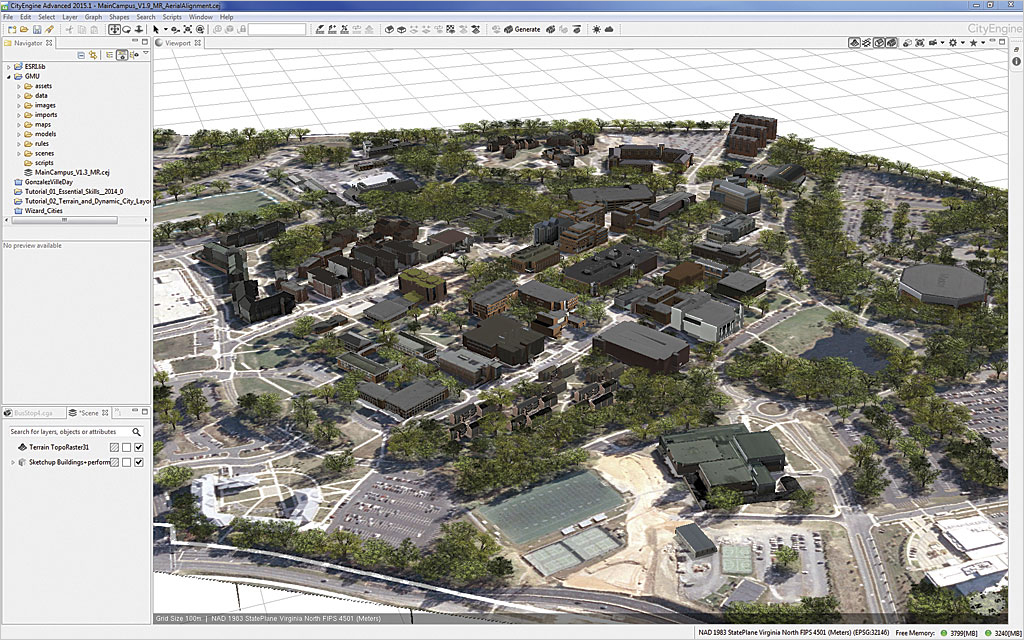
The completed campus model was exported to Esri CityEngine Web Scene format so it could be viewed on the web and used for further application and research projects. Several layers can be turned on and off in the web scene to create a desired realistic or abstract representation.
This project served as a research environment for conducting spatial analysis that would have been more difficult to do otherwise. Research projects that grew out of the model included simulating the impact of building renovation on shading and skylines, visual analysis of the CO2 equilibriums on the GMU campus, and analyzing correlations between shuttle bus demands and parking occupancy. The web scene displays realistic buildings overlaid on the campus map. The layers showing building use by color, analytical trees, CO2 emissions density, CO2 sequestration density, and parking structures can be toggled on and off. This model will provide assistance to other research projects and may serve as an aid for decision making by the campus facilities and transportation departments.