The idea of using a map to tell a story is not new. Maps have always been the perfect tool for explaining where something exists (or occurred) and how that relates to other events that are part of the story or message being delivered.
Well, the GIS gurus at Esri have come up with some nifty templates that make it easy to build an interactive Story Map app using your data. If you have a story to tell, all you need is some simple point data, photos, or videos, a little narrative text, and an ArcGIS Online account. Individuals, bloggers, students, and others can use ArcGIS.com for free. Just create a public account (look for the link at the bottom of the ArcGIS.com sign-in page).
Here in the Bluegrass State, we are very lucky to have an abundance of thematic data layers that are appropriate for storytelling, so the staff at Kentucky Division of Geographic Information (DGI) began pulling together the resources necessary to create an effective Story Map app. We created feature services on our ArcGIS for Server instance, but we could have just as easily uploaded shapefiles or comma-separated values (CSVs) to ArcGIS.com.
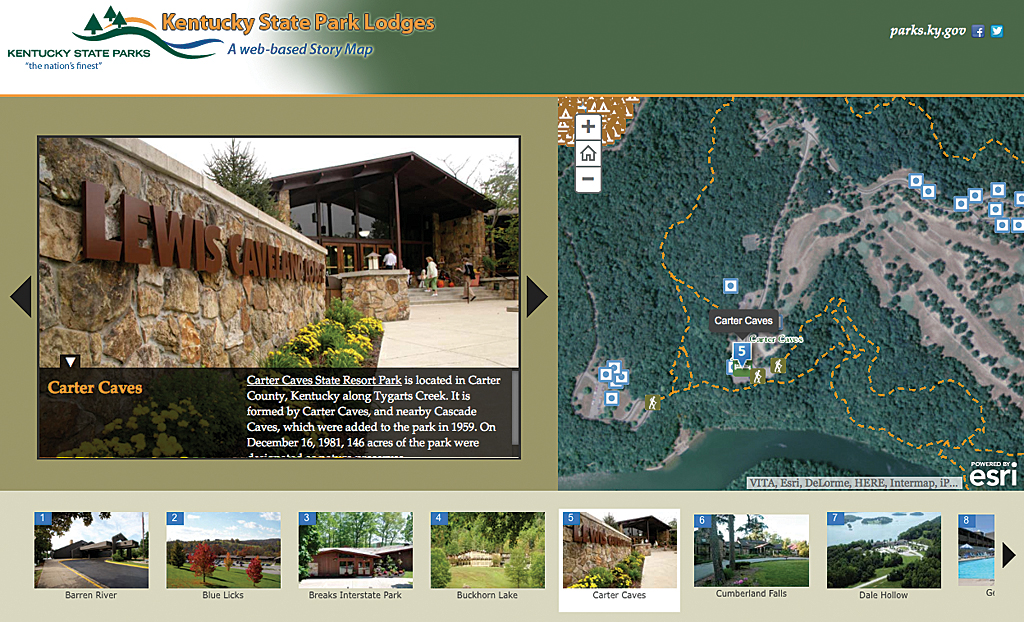
The first Story Map app was one highlighting the lodges at Kentucky’s state parks. We collaborated with the marketing and GIS staff at state parks to make this happen. They supplied some outstanding photos and reviewed their GIS data to make sure everything was in order.

We created a web map on ArcGIS.com using the data, the photos were placed on a web server, and the Map Tour Story Map app template was downloaded from Esri. Wiring up the template to our data was a breeze, but our app had the same look and feel of all the other Story Map apps. We needed to make ours unique and engaging.
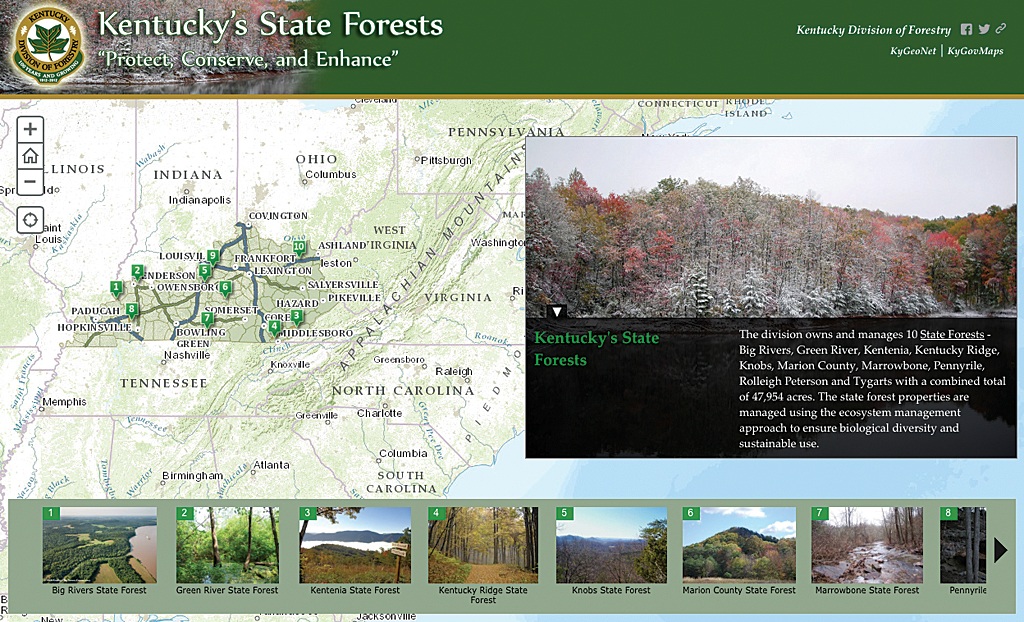
The Esri Insider blog post “Creating and Customizing a Story Map—From a Non-GISer,” supplied just the information we needed. If you understand CSS, can leverage the developer tools in your browser, and know your way around Adobe Photoshop, you can easily brand your Story Map app. I have described the steps I used to customize the Kentucky State Forest Story Map app.
Deciding on a Color Scheme
I visited the Kentucky Division of Forestry website, where I copied the new logo. The colors used in the logo were the basis of the site’s color scheme. Using Adobe Photoshop, I got the hexadecimal values for those colors. With those values, I touched up the underlying HTML using Xcode on the Mac. [Xcode is an integrated development environment that is a free download from Apple.]
As noted in the blog post, the inspect element feature in the browser could be used to identify some of the styles driving the Story Map app template. Starting at the top, I first changed the background color of the header to match the green color in the logo.
Creating a Custom Header
Next, I worked up a nice graphic for the header using a beautiful photo provided by the Division of Forestry. I added a title and subtitle as part of the graphic and did not use the configuration option, leaving those values empty.
The height of the graphic was 115 pixels, so the height of the header was defined accordingly. Take a look at the code in Listing 1 to see how background value color, header graphic, and height of the header were defined within a single style tag.
Another stylized feature I’ve added to some of our Story Map apps is a 6-pixel border between the header and the body of the map. I added the style directly within the header div and used the gold color in the logo. This really made it stand out.
Styling the Rest of the Map
All the links on the right-hand side of the header can be styled too. In this instance, I changed the font color to white so the links could easily be read on the green background. I picked a font that looked good with the text used in the header graphic. Listing 3 shows the style tag with the values needed to achieve the desired appearance.
We chose standard green markers for this forestry-related Story Map app. I did a screen capture of the app and got the hexadecimal value of the marker color using Photoshop. This color was used for the name in the picture panel (Listing 4). The font family was set to match the font used for the links in the header. Consistency in type styles makes for a polished looking app.
Moving to the footer, I chose a nice green color that complemented the color scheme.
Using the Same Approach
So, with very little coding, I was able to take a stock Story Map app and give it a unique look and feel that sets it apart from others. The same approach was employed to customize Kentucky’s other Story Map apps. Look at them and you’ll notice the color scheme for each was derived from each entity’s logo or the colors on its website. Taking the time to customize a site will ensure that it stands out from the growing crowd.
About the author