With an abundance of satellites and remote-sensing devices monitoring weather systems all over the world, meteorologists now have more data available to them than ever before. But more data doesn’t necessarily translate into improved predictions.
Because of the size and complexity of weather patterns, they can be very difficult to predict more than a few days in advance. Researchers continually refine their instruments and processes to better understand the climate and make more accurate weather forecasts.
Esri partner Weather Decision Technologies, Inc. (WDT), uses advanced GIS from Esri to better organize and analyze this big data. WDT provides weather forecasting and mapping services to many industries: energy corporations to help them predict electrical outages and keep offshore oil rigs safe; agriculture agencies for crop insurance; freight transportation companies to aid with route design; and concert and sporting event organizers for planning and safety.
“The amount of data that we collect is enormous, about one terabyte per day,” said Matt Gaffner, GIS solutions expert at WDT. “Over the years, we have assembled an archive of almost half a petabyte of weather data.”
Analyzing Clouds in the Cloud
The company currently uses ArcGIS Server to develop all its map services for customers, though it plans to upgrade to ArcGIS Enterprise later this year.
“One of the great things about the ArcGIS Server platform is that it’s extremely easy to publish live, dynamic, rapidly updated data and then host it as a service for use with other applications,” said Gaffner. “This allows our users to quickly add past, present, and future weather data to their maps and apps.” It also enables WDT’s partners that build apps for specific vertical markets, such as utilities, to add weather data to their apps using WDT’s map services.
Cloud computing is key to WDT’s operations. The company uses Amazon Web Services (AWS) to deploy the analytical and mapping services that ArcGIS Server provides. “There are so many advantages available to us by using Amazon Web Services,” Gaffner pointed out.
With cloud services, the company can stand up multiple machine instances of ArcGIS Server to determine the operational stack that runs the best. “For one thing, it allows us to implement the ‘fail faster’ mantra. Using the ArcGIS Amazon Machine Image (AMI) capability, we can easily stand up a version of the server in the cloud and try something new—like using different machine hardware specifications or configuring data services differently—to see if it works or not. If it works, great. If it doesn’t work, then we stand up another instance and try something else.”
“AWS provides us with reliability because if something goes wrong, we can easily replicate ArcGIS on another machine in the cloud,” Gaffner said. “It also provides us with load balancing—that is, we can redistribute the many requests we receive for weather data and map services between our servers. This extra demand normally happens when the weather changes and storms begin to develop. Our datasets increase in size then because there is more radar data accumulating, and our customers need access to that data.”
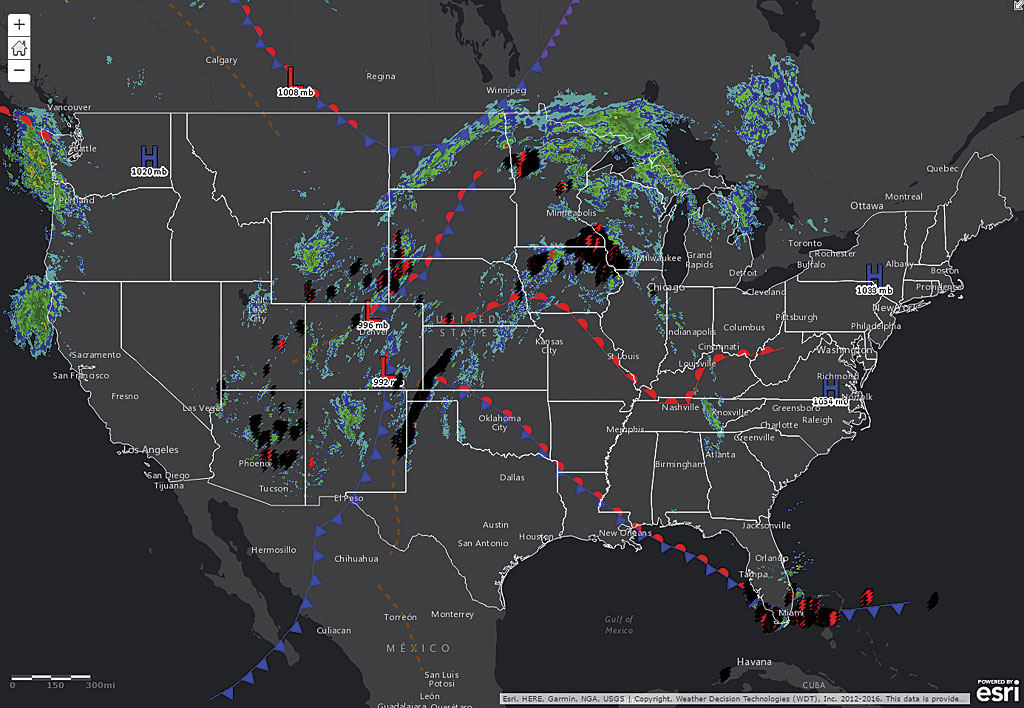
WDT is currently doing a lot with time-enabled map services. For example, users can loop through the last 60 minutes of radar data to see where a storm has been and where it is headed. WDT is also launching a time-enabled global forecasts map service that will provide both daily and hourly forecasts for all the normal weather variables—temperature, precipitation, wind speed, and direction—out to 10 days. Because the company is serving out bigger datasets to accommodate more requests, using cloud services makes WDT’s servers scalable at critical times.
Environmental Conditions Affect Businesses—and Decisions
WDT’s ever-growing collection of big geospatial datasets allows users to conduct unique analyses across time and space. For example, one of its customers—an oil and gas company—wanted to determine how much the weather affected the productivity of its crews in Oklahoma versus Colorado.
“They wanted to figure out the productivity of each, but they wanted to statistically normalize that comparison by taking into consideration the local weather conditions,” explained Gaffner.
During the summer, it could be 90 degrees in both Oklahoma and eastern Colorado, but with more humidity in Oklahoma, the heat index would likely be higher than in Colorado. “By using historical weather data,” said Gaffner, “we were able to perform this analysis and found that weather can impact crews in two ways: decrease worker efficiency under heat stress and push the heat index above a critical threshold where workers are required to take mandatory breaks.”

WDT is also considering the impact that the Internet of Things (IoT) will have on geospatial analysis.
“Take, for example, the connected car,” said Gaffner. “We can provide real-time weather or a weather forecast to your car that might tell you, ‘Hey, you should probably stop driving to avoid that storm,’ or, ‘There’s a line of thunderstorms moving through your area; you might as well stay at work for another 20 minutes and wait until it passes through and then drive home.’”
If weather and environmental data is combined, it can help mitigate risk and enable people to make smarter decisions. And, as Gaffner hopes, the confluence of big data with smart analysis can save lives and property in the long run.
For more information on WDT, visit wdtinc.com.
