
Riverside County, located in Southern California, is known for many things. It was the birthplace of the California citrus industry. It is currently the fourth most populous county in the state. And it has been, over the past 50 years, one of the fastest-growing areas in the entire nation.
However, the county’s CEO Jay Orr wants Riverside County to be known for something else—for being the best place in America to live. Orr believes that the delivery of “customer-centric public service that is better, faster, and fiscally prudent through technology” is critical to making this vision a reality. To help accomplish this, the county has adopted a new enterprise GIS strategy that makes extensive use of ArcGIS Online.
A GIS Veteran
GIS is not new to Riverside County. It was an early adopter of Esri software and began integrating GIS technology into government functions in 1989. The county soon found innovative ways of applying GIS.
For example, in 1993, when fires burned thousands of acres in the county, the GIS team assisted the Emergency Operations Center with its response efforts by identifying the owners of destroyed or damaged properties to speed recovery assistance. Subsequently, GIS also helped determine the boundaries of burned areas so strategies for controlling flooding and mudslides could be developed and damage to environmentally sensitive areas evaluated.
As the cost and operational efficiency benefits of GIS were recognized, individual departments implemented GIS with great success. The county Transportation and Land Management Agency (TLMA) and sheriff and fire departments made extensive use of the technology and worked together to facilitate the creation, maintenance, and use of foundation GIS layers such as parcel, road network, and point locations. Other county departments that have made substantial use of GIS include the Riverside County Department of Public Health, the Riverside County Flood Control and Water Conservation District, and the Assessor Clerk Recorder.
A New Vision
County leaders, who were dealing with the effects of the recent economic recession, began exploring ways that technology could be used to deliver more value for the county. Although it has had a successful history in Riverside County, GIS was identified as a technology with the potential to deliver even greater returns.
The decision was made to move from a collection of individual GIS implementations to a truly enterprise-wide GIS centralized in the Riverside County Information Technology (RCIT) department. The county’s enterprise GIS is not designed to be a one-size-fits-all solution. Riverside County CIO Kevin K. Crawford noted that while it transcends departmental interests, enterprise GIS must support departmental and operational requirements. It must serve, not detract from, the business functions of each department and be implemented to meet the varied business requirements of county agencies. The goal is not just sharing automated data but improving business processes.
“The principle purpose is to implement a shared vision for the use of GIS and geographically based data,” according to Colby Cataldi, assistant CIO, who oversees enterprise GIS. “The vision represents the crucial outcome of action, direction, purpose, collaboration, and willingness to bring the best thinking into discussion about global issues that may appear to be unique to a department or agency but may also affect departments countywide.”
In 2012, the TLMA GIS group moved to RCIT and the county created the Geographic Solutions Division (GSD), which manages the county’s enterprise GIS. GSD supplies a variety of geospatial services not only to internal customers but also to the Southern California Association of Governments (SCAG); University of California, Riverside (UCR); the Western Riverside Council of Governments (WRCOG); and the Coachella Valley Association of Governments (CVAG).
In 2011, the county entered into a public safety enterprise license agreement (ELA) with Esri. That experience led the county to evaluate a broader, countywide ELA. With wider access to GIS software, the county could more easily develop a common GIS framework that would improve collaboration within and across departments, make staff more efficient and productive, and enhance customer service. The countywide ELA, signed with Esri in November 2012, has enhanced sharing of GIS information across the organization, with business partners, and the public.

A Dramatic Change
With its ELA, Riverside County gets an ArcGIS Online organizational account that provides a large block of named users and credits. This opens up GIS resources to the entire organization as maps, apps, data layers, and web services, eliminating the learning threshold that had limited access to and benefits from the county’s GIS.
With ArcGIS Online, a cloud-based system for creating and sharing maps and geographic information, organizations can upload and easily publish data to create intelligent web maps that can be viewed on any device and embedded in websites, blogs, and applications. ArcGIS Online users have access to ready-to-use, high-quality global basemaps that are constantly updated and data that has been shared by others.
Previously, users of the system needed at least some level of GIS knowledge to directly use the system. Often, the value derived by those working directly with the system was dependent on their skill level with the software. Non-GIS staff members obtained maps and reports by making requests to GIS specialists.
The county will still require GIS professionals to perform analysis, create and maintain data, and develop web maps and apps. However, once created, those maps and apps can be made immediately accessible to knowledge workers, decision makers, other non-GIS staff, and the public via ArcGIS Online. Everyone in the organization can be empowered to get the maps and answers they need. They can also contribute back by adding data, refining information, and creating their own maps shared on ArcGIS Online. This helps the entire organization by allowing decisions to be made based on the best available information. This dramatically increases the value the county receives from its GIS.
ArcGIS Online is seen by the county as a key component of its enterprise strategy. Implementing ArcGIS Online “will transform the way we spatially interact with data and information,” according to Tom Mullen II, assistant CIO. “The ability for policy makers to spatially see the affected areas of the county and how citizens are cared for, in an interactive map, adds to their depth of knowledge and understanding of the unfolding events and how best to effectively respond to the areas of greatest need in a dynamically changing environment. It provides a department [with] the ability to spatially visualize relationships between services they provide and the communities they serve in an interactive map,” said Mullen.
In this cloud-based environment, users can quickly create maps utilizing standard templates and best-practice cartography. Using templates also gives maps on the county website a standard look and feel as well as helps county staff rapidly deploy them.
Reaching a Larger Audience
Shortly after signing the ELA in November 2012, the county started creating web maps and apps. By March 2013, the first ArcGIS Online maps were up.
The county’s externally facing sites furnish information to county residents and the general public. These sites also promote government transparency. One of the first sites to take advantage of ArcGIS Online capabilities was the Meet the Supervisors site. Using an Esri story map template, this site introduces each supervisor, indicates the location of the district served by that supervisor, and links directly to individual district websites.
The County of Riverside Ag Trail website leverages ArcGIS Online through a collection of embedded web maps that show the location and give directions and website links to more than 100 businesses and events related to agriculture in the county. This information is of interest to both residents and tourists. Maps feature farms; wineries; fairs and festivals; and stands and markets that sell organically grown products, fresh fruits, and vegetables.
Because building healthy communities is a top priority for the county, the Riverside County Department of Public Health (DOPH) has used ArcGIS Online to create many kinds of information products, such as the County of Riverside Healthcare Inventory map, which helps residents locate health service providers near them such as hospitals and clinics.
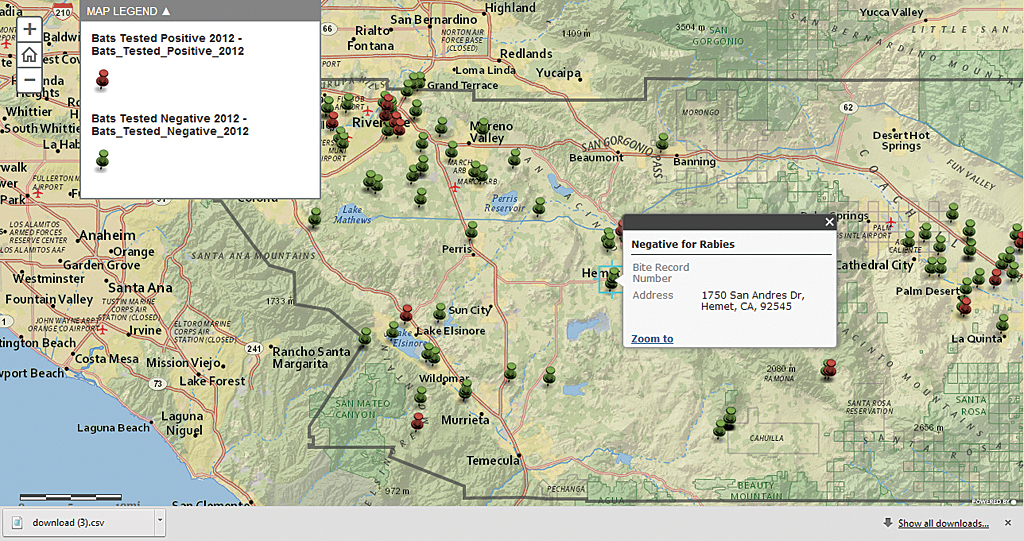
Other county internally facing websites use ArcGIS Online maps to enhance communications within and between county agencies and departments to improve operations. The Department of Animal Services tracks the occurrence of rabies in bats by mapping locations where it has impounded bats and results of tests on those bats.
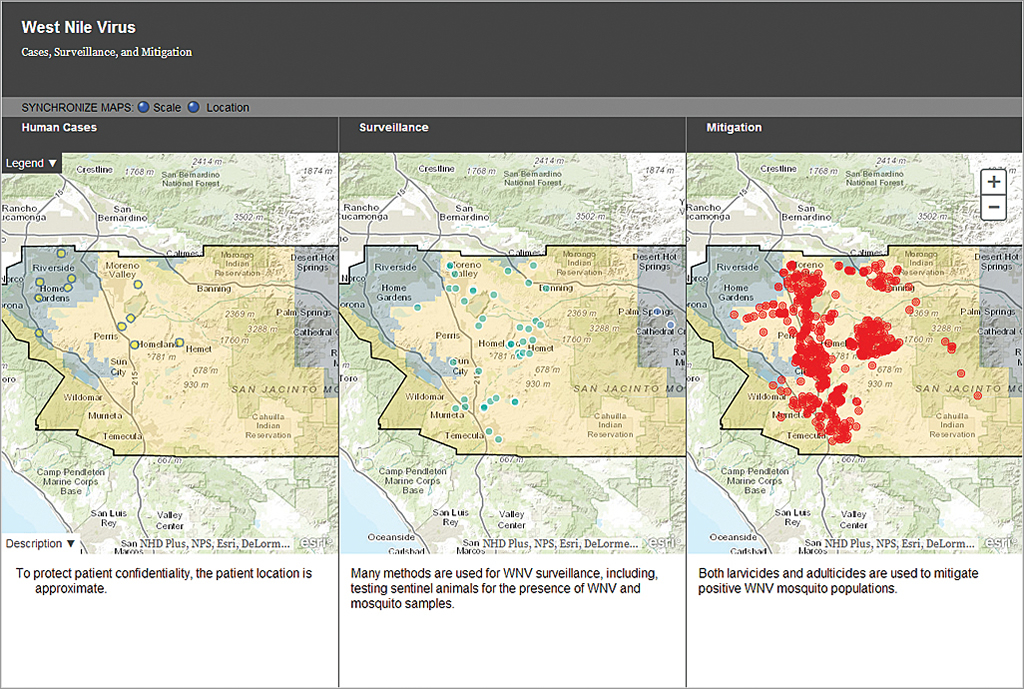
The West Nile Virus Activity map reports the location and status of surveillance traps, the location of spraying sites, and the boundaries of vector control districts in the county. Information on the occurrence of West Nile virus in the human population, as well as surveillance activities and mitigation efforts, can be compared using a three-paneled web mapping application. (Patient confidentiality is protected by supplying only approximate locations on the map.)
Some ArcGIS Online maps, like the Licensed Healthcare and Social Vulnerability map, help policy makers identify potential problems so they can be mitigated. On this map, care facilities, services, and clinics are mapped against the USA Social Vulnerability Index (SoVI), which measures the vulnerability of US counties to environmental hazards based on factors that may reduce a community’s ability to recover from floods and other hazards.
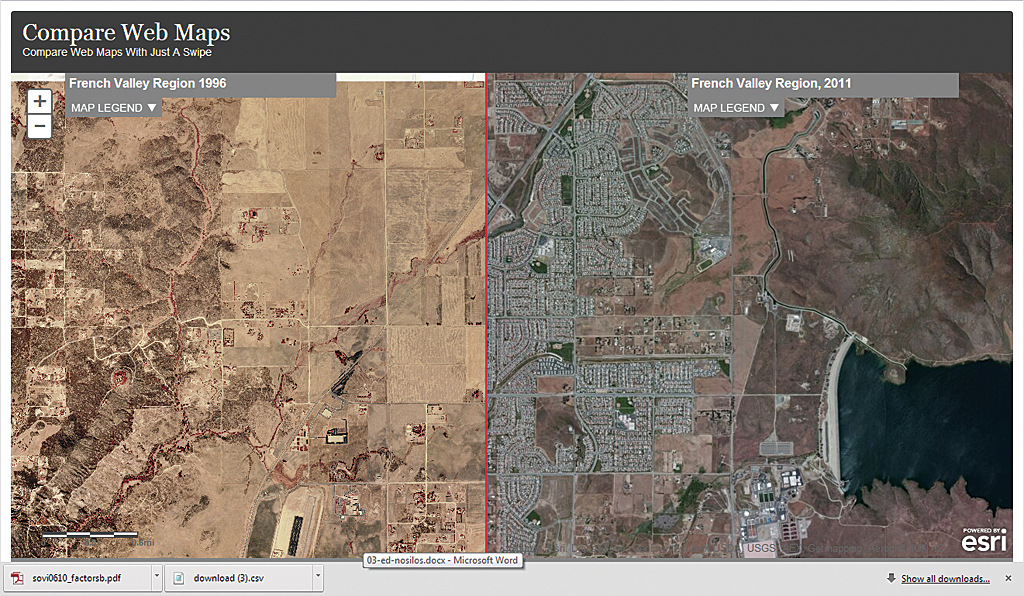
Other maps provide greater perspective for policy makers. A three-panel map shows changes in the population density for the desert community of Mecca. Data for 2000 and 2010 can be compared with projections for 2050. Another map lets the user swipe across the map to compare the dramatic growth that has occurred between 1996 and 2011 in a portion of southwestern Riverside County known as French Valley. Maps like these can help county staff make better decisions regarding where to strategically locate resources to best serve the needs of residents today and tomorrow.
Ingredients for Success
A clearly enunciated vision of the role of GIS in the county and buy-in by the top departmental leadership have contributed to the success and growth of enterprise GIS. By eliminating redundant and competing systems, the county is saving both time and money. ArcGIS Online is making information in the county’s GIS directly available to knowledge workers and decision makers in a timely fashion.
The enterprise GIS remains a work in progress according to the county’s CIO. The county will focus on the five patterns of GIS business behavior: data management, planning and analysis, field mobility, operational awareness, and citizen engagement. “Moving forward, Riverside County will develop and deploy a common GIS standard and continue to leverage the power of geographic data in an effort to expand the use of shared information; improve the business processes; and promote more timely, informed decisions,” said Crawford.
About the author