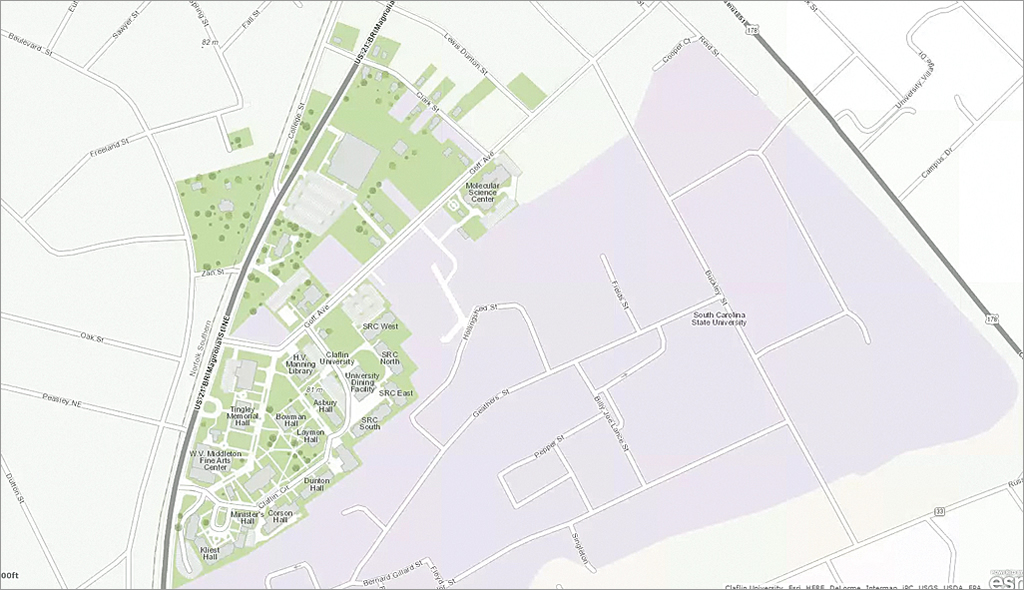
Students in a small South Carolina university used Esri Community Analyst to answer an important question: “Where will I look for work after graduation?” These students were enrolled in an elective geography class at Claflin University (CU).
This fairly small university in Orangeburg is located in a predominantly rural area and serves a student population of almost 2,000 that is more than 90 percent African American. In an effort to enhance the technical and analytical abilities of its majors, the Department of Social Sciences has subscribed to Community Analyst for the past three years. The user-friendly mapping tool was seen as a more appropriate way of gradually integrating spatial concepts into the social sciences. Consequently, Community Analyst was incorporated into several elective geography courses as well as utilized in applications in the fields of sociology, criminal justice, urban planning, and political science as part of senior theses or class research projects.
Community Analyst, a cloud-based mapping solution that provides up-to-date demographic, health, crime, census, business, social, and cultural data available in a “Walmart one-stop shopping” style can help students without any prior mapping experience easily fuse their theoretical, discipline-specific knowledge with real-world applications. It works well with class projects and research papers in various disciplines and does not require substantial technical skills.
One project at CU has been very successful in raising students’ interest and improving their understanding of how mapping can become useful in real-life career choices. Entitled “Where should I look for a job after graduation?,” the project was implemented as part of an elective geography class with mixed student enrollment from education, social sciences, and mass communication.
To complete the project, students followed these steps:
- Write down the names of two US states where you would be most likely to look for employment after graduation.
- Pick two favorite counties per selected state.
- Select five criteria (variables) that matter most to you when looking for employment in an area such as educational attainment or availability of employment pertaining to your career field.
- Open Esri Community Analyst and select those five variables in Smart Map Search. Select ranges as appropriate (e.g., high educational attainment, high diversity index, low poverty, lower percentage of people in health care/social assistance industries).
- After identifying the two top states meeting your five criteria, zoom in to find two counties that most closely match the same criteria in each state. Compare them to your initial options. Are they similar? Are they different?
- Start a web search for available employment in selected areas. After finding a job opportunity, start looking for a place to live. To identify the best matching neighborhoods, explore the Esri Tapestry Segmentation data to obtain an in-depth understanding of neighborhoods. Tapestry Segmentation uses 67 unique segments based on demographic and socioeconomic characteristics. Search the online real estate offerings in areas selected based on Tapestry Segmentation and find your new home.
The project takes about two hours to complete. Students found this short project very interesting. It helped them consider the implications of finding and keeping employment in an area that does not meet their demographic and socioeconomic expectations. At this minority-serving institution, the student population mostly comes from rural and socioeconomically challenged communities. Interestingly, variables such as crime index, poverty, and per capita income were found in every individual project.
Crime rate, in particular, became a major decision factor in state selection. This favored states, such as South Dakota, North Dakota, Vermont, New Hampshire, Minnesota, Iowa, and Wyoming, that have low crime rates. To address this limitation, students adjusted other options but still kept crime rates low. After adjustment, students preferred Pennsylvania, Virginia, New Jersey, or Colorado.
Another interesting criterion was diversity, a variable available in Esri Community Analyst. The Diversity Index is part of Esri’s 2015 Race and Hispanic Origin demographics database. Most students selected it at first. Then, after realizing that the diversity index relies heavily on the racial composition, students opted for low levels of diversity instead of high diversity, which they originally chose. Some replaced diversity with 2015 Black/African American population.
Overall, the project encouraged students to actively think of their future career in connection to elements, such as demographic and socioeconomic characteristics of an area, in addition to actual employment opportunities. Community Analyst is a great tool for enhancing teaching at all levels. It was easy to use and made GIS capabilities available to every user.
Using Esri Community Analyst increased students’ visual-spatial literacy and exposed them to the opportunities spatial analysis can offer in social sciences. By utilizing mapping technology to narrow down their location search according to personal life expectations, these students learned the relevance of place to social life. In addition, it helped students gain a more practical understanding of variable selection and its role in decision making. Esri Community Analyst became an interesting, fun way of conducting spatial analysis to meet the challenges of personal real-life situations.
About the author