We hear it repeatedly at conferences, in blog posts, and in articles—Web GIS is the future and is here to stay. Web GIS, the latest paradigm shift in our industry, means that GIS experts can put the power of data, maps, and analysis in the hands of more users, both internally within organizations and externally to the public.
In this article, I’ll describe techniques and ideas for managing geospatial data and author content that speed publishing, display, and organizational adoption of the data and maps served via the web. I developed these ideas while working as a GIS specialist in a county emergency management agency, a major city’s enterprise GIS shop, and as a contractor for a federal agency that manages land and natural resources. The ideas presented don’t necessarily reflect the practices or views of my current or previous employers.
Cultivate a Publisher Stable
All of the tasks we used to rely on desktop software for—mapping, analysis, and even data creation and updates—can now be accomplished easier, faster, and by more users using thin client applications accessed via a web browser or mobile device.
In the wonderful world of Esri software, ArcGIS for Server and ArcGIS Online are the Web GIS power tools of choice. Each has specific use cases, terminology, and workflows that may be unfamiliar to GIS staff with a desktop background. Organizations and their GIS managers frequently designate a single staff member or small group to administer these systems. This is a good thing, because these Web GIS admins become the in-house experts who conduct research and development and lead the adoption of Web GIS for the organization.
The problem with this model arises when a mature GIS shop neglects to train additional skilled GIS staff in the essential workflows of Web GIS publishing and leaves the entire workload to just one or two admins. Preparing data and maps for web publishing involves some pretty specific steps above and beyond what is typically required for desktop mapping and analysis. Without a well-trained stable of GIS specialists familiar with the web publishing workflow (and the specific needs of the customer), publishing throughput decreases and productivity declines. Conversely, a well-trained roster of GIS specialists fluent in the language and processes of web publishing enhances an organization’s Web GIS and speeds implementation.
The 90 Percent Principle
When managing data for Web GIS, strive to streamline workflows, develop tools, and provide training to cover 90 percent of publishing scenarios. Esri is adding new types of services and functionality all the time, so think about the most common publishing jobs and design the data management environment and protocols for those jobs.
Frequently, this means facilitating a streamlined process for publishing enterprise data as dynamic map services or editable feature services. I browse the public REST service directories of a lot of organizations, and from my observations, these types of services account for roughly 90 percent of what’s out there. This does not mean that other types of services aren’t important, but they are less common. If your publisher stable is able to handle the most common publishing jobs, the Web GIS admins can focus on more complicated publishing tasks such as cached map services, geoprocessing services, geodata services, and geoevent services.
Manage Data Upstream for Faster Publication Downstream
As data and its renderings flow from geodatabases to map documents; services; web maps; and, finally, full-fledged applications, data properties are inherited from each previous step. This means that if you want a layer name formatted in a particular way in an application, that formatting must occur manually or automatically at some point upstream from that app. Data managers can aid their publisher comrades by implementing things like feature class aliases, field aliases, and proper metadata early in the publishing workflow. With rigorous implementation, an effective data manager can handle around 90 percent of the configuration that publishers would otherwise be burdened.
Suppose your organization maintains a roads feature class called “city_rds” that has field names that are similarly abbreviated. This type of naming convention is extremely common in desktop GIS environments—and for good reason. Table and column names are frequently constrained by naming conventions for file and versioned geodatabases required so that names will be valid.
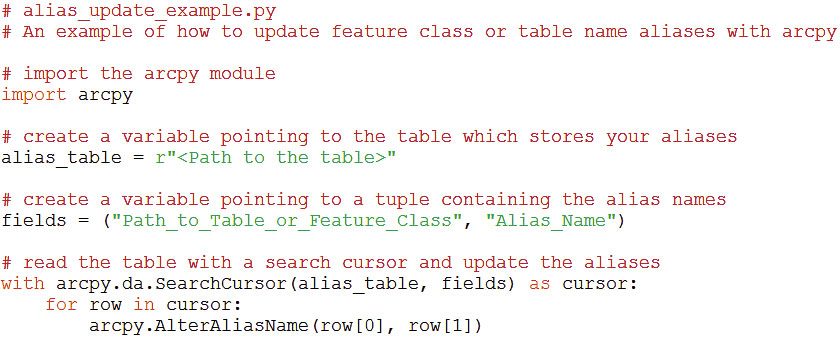
The good news is that there is no need to change the raw feature class or field names even if 90 percent of the time you want users to see “City Roads” as the name of that layer. The geodatabase allows data managers to implement user-friendly aliases in the raw GIS data. This can be done manually in ArcCatalog or automatically using the arcpy.AlterAliasName function for tables and feature classes and using the arcpy.AlterField_management function for fields. Using Python, aliases can easily be managed in a table for hundreds or thousands of datasets. When added to a map document, the feature class alias will display as the layer name, and the field aliases will display as the column names by default. Python scripts or other programs accessing the raw names will not be affected, so there is no need to change any code.
Exercise care with field aliases when publishing map services for ArcGIS Open Data. ArcGIS Open Data is a fantastic way for organizations to make their data accessible to the public. However, as of this writing, datasets can only be downloaded from ArcGIS Open Data in CSV (nonspatial), shapefile, or KML format. Since shapefiles only allow 10-character attribute names (and do not support aliases), consider limiting attribute aliases to 10 characters for feature classes that will be shared via ArcGIS Open Data.
Data manipulation processes sometimes result in feature classes with a lot of duplicate, confusing, unused, or empty fields. It’s a good idea to remove these in the master source data so that publishers don’t need to hide them later on. Consider ways to identify and remove duplicate fields and fields containing 95 percent or more null values. Nothing confuses the public more than a pop-up with confusing or unhelpful attributes. Worse, extra attributes will hurt performance.

What about Metadata?
I’ve seen it again and again in REST service directories: loads of useful and interesting data published on ArcGIS for Server with zero documentation available to the user. How can organizations be confident that their authoritative data and services will be used appropriately in this situation?
If your organization uses Esri’s framework for managing its metadata, which is stored in the geodatabase, modified in XML, and available in multiple styles, then good for you. Much of the work is already done. Your data is documented in its raw form, and the core metadata components will propagate down through the publishing workflow with minimal burden on your publishers. If not, think about ways to migrate your metadata content stored in some other system into the feature layer descriptions in your published map documents.
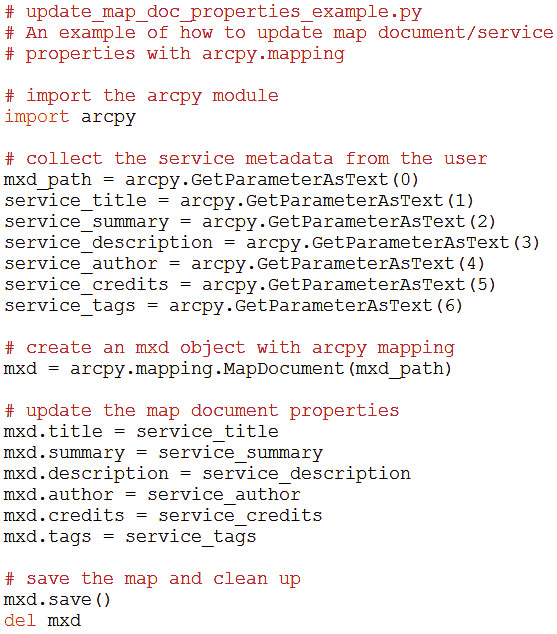
There is still the need for service-level documentation so users can access the description, credits, tags, and other information specific to a service. These properties are added using the frequently overlooked Map Document Properties dialog box in ArcMap. Fortunately, the ArcPy mapping module makes the metadata for map services (and the specific layers those services contain) quick and easy to add. ArcPy mapping enables programmatic access to nearly all the map document and layer properties that provide metadata to published map services. Savvy admins can easily design forms and tools to collect service metadata from the requester, publisher, or customer and update it in all the right places so publications are thoroughly documented.
Maximize Performance
As the number of end users for your Web GIS grows, you’ll want to consider how you can maximize the performance of your Web GIS products. In most cases, this means keeping the draw time for map services as short as possible. Fortunately, the same practices that result in a fast map document will result in a fast map service. I consider three main areas when approaching map performance: filtering to limit the number of features, limiting vertices (or eliminating them altogether through rasterization), and creating indexes.
Effective filtering limits the number of features displayed at a particular scale or in the whole map. Fewer features equal faster draw time. Scale dependencies are a good place to start.
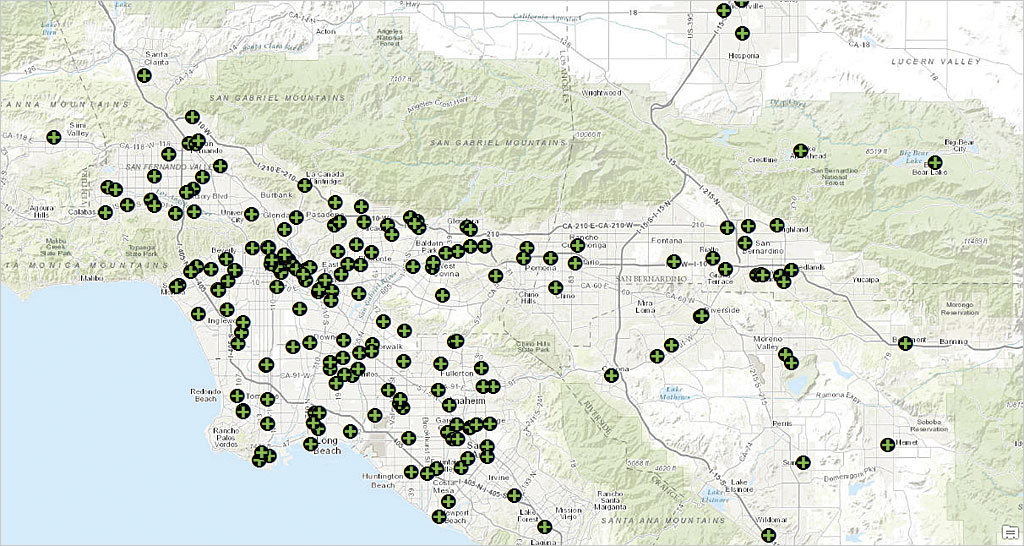
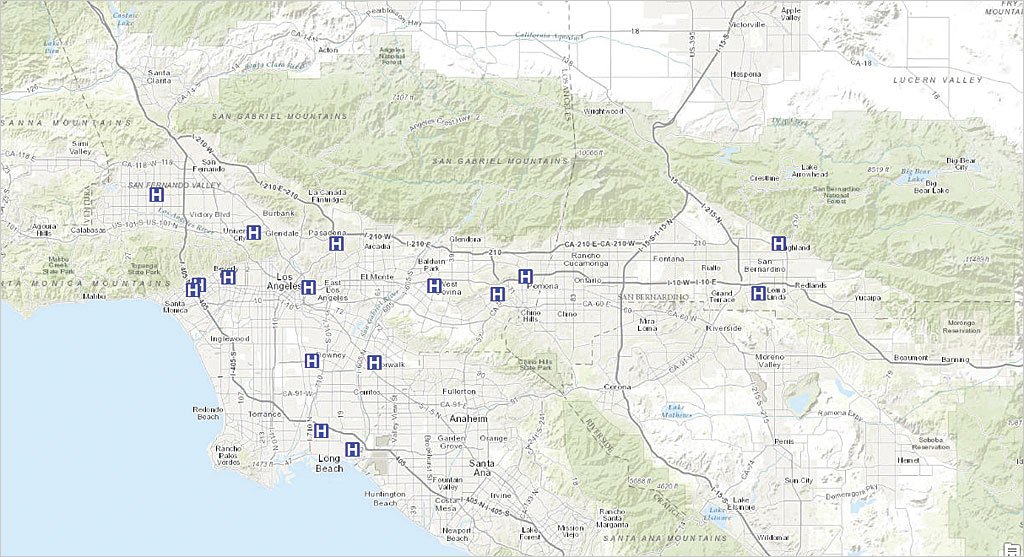
Consider at what scale range each layer should be viewed and set scale dependencies accordingly. If you are publishing a service to be used in a web map that will show state emergency planners the distribution of hospitals in their state, set a scale dependency on your hospital points layer that will make the points invisible beyond a statewide scale. If individual buildings within each hospital complex are to be represented as polygons, set a scale dependency on the hospital building polygon layer so that it only draws at or below a neighborhood scale.
Creating definition queries is another important technique for filtering data. Employ definition queries to filter out features not needed in the published rendering of your data. If hospitals are the only features you need to show, create a definition query that prevents other types of buildings from being displayed.
Limiting the number of vertices returned by a request to ArcGIS for Server will help optimize the performance of dynamic map services. When a web client makes a request to ArcGIS for Server, the server delivers a text-based representation of the geometry, attributes, labels, and renderer. With that information, the application generates an image displayed on the map. For vector data, the coordinates of the vertices that form the points, lines, and polygons you want to draw make up a huge chunk of the information delivered to the client, so limit the number of vertices returned by each request to the server whenever possible. Consider using definition queries, scale dependencies, and cartographic generalization to reduce the number of vertices. Remember: if a layer draws slowly in ArcMap, it will also draw slowly in a web map.
If publishing a vector layer with only one important attribute, consider rasterizing the layer and publishing it as an image service. Raster datasets frequently draw much faster than vector datasets, especially when the vector dataset contains many long, skinny, snake-like features, which are hard to index efficiently.
Indexing GIS data is just like indexing a lengthy, complicated book—it helps find the information you need much faster than hunting through each page for a particular word or phrase. In GIS, we are referring to spatial indexes and attribute indexes. File and enterprise geodatabases automatically generate spatial indexes, but they should be reindexed after lots of new features are added or if the extent of a feature class has been drastically changed. When preparing GIS data for publication, think about which attributes will need to be queried frequently and consider indexing those attributes. Although I haven’t quantified this, I think it is a good idea to also index attributes that participate in label expressions, definition queries, and symbology schemes.
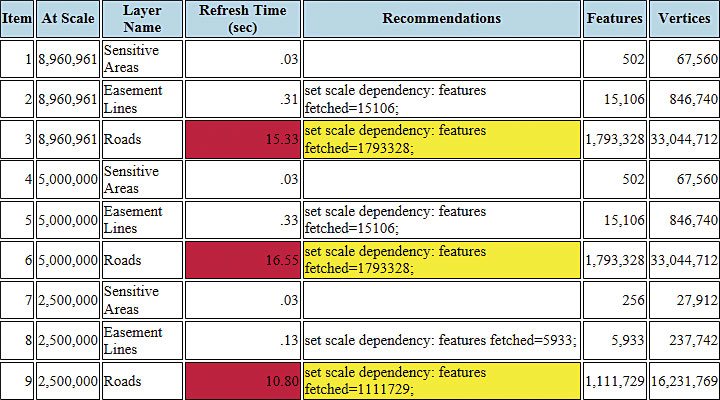
Luckily for draw speed freaks like me, there is an excellent (and free) command line performance diagnostic tool called mxdperfstat. Developed by the Esri Enterprise Implementation Team with ArcGIS Engine, mxdperfstat will clock the draw speed of every layer in your map document at a range of different scales and generate a user-friendly report. Mxdperfstat even recommends actions that can speed up slow-drawing layers. This tool can be run directly from the command line or called with Python’s subprocess module within the Python window in ArcMap or in a custom script tool.
I hope these practices will help your organization embrace and optimize Web GIS. Wishing you happy publishing. For more information, contact
Micah Babinski
GIS Project Manager
Elyon International, Inc.
m.babinski.88@gmail.com
T 503 734 6680
About the author