When disaster strikes, few people consider themselves lucky to be in the storm’s path.
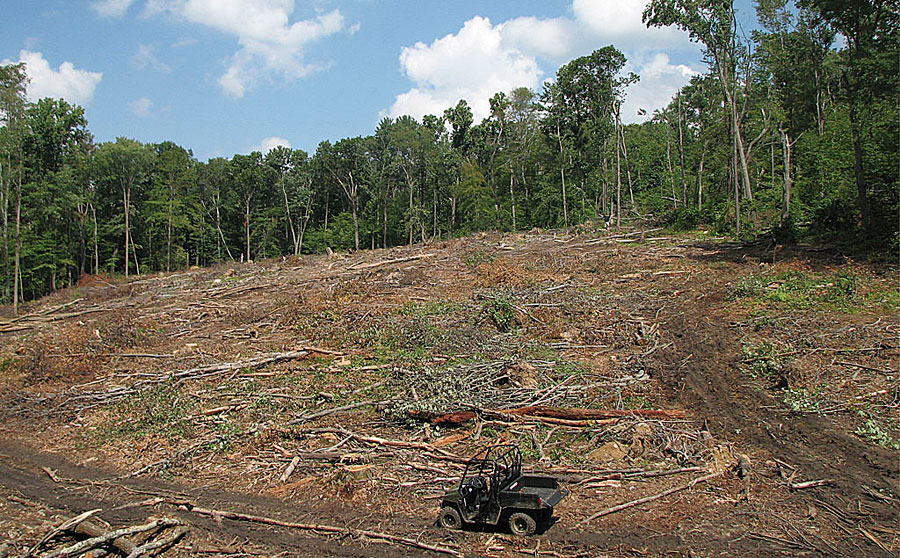
After a tornado struck southwestern Pennsylvania’s Powdermill Nature Reserve on June 1, 2012, the environmental research center of the Carnegie Museum of Natural History found itself in just that position. Following large storms that damage forests, land managers interested in balancing economic concerns with environmental stewardship must decide if, and how, to perform salvage logging.
Recognizing this valuable research opportunity, Powdermill’s GIS lab sprang into action to map storm damage on the reserve. Once the extent of the damage was assessed, the research team decided to split four large (10–20 acre/4–8 hectare) damaged areas in half, randomly assigning half to be logged and half to be left as is to compare how these areas respond to management decisions.
As the scientific value of these study areas became clear, researchers flocked to the project, some coming from as far away as the Czech Republic. GIS became increasingly valuable for allocating limited space and efficiently collecting and managing data generated from multiple field surveys by these researchers.
UAVs Supplement Field Methods
While field surveys provide detailed information on the status of various taxa, the GIS lab needed to develop a current picture of the forest structure across the entire site that could be used as a framework for organizing research. Although remote sensing seemed a logical choice because it offered repeatability and coverage, much of the available geospatial data lacks either the temporal or spatial resolution to be very informative.
For example, Landsat has a 16-day cycle that makes recent data available, but its 30-meter resolution is insufficient for studies at the scale required. Conversely, county aerial imagery flights provide finer spatial resolution in visible bands but are only collected every three years. Pennsylvania has a solid baseline of lidar data from 2006 to 2008, but there are currently no plans for additional flights.
Given these limitations, the team turned to an emerging tool, unmanned aerial vehicles (UAVs), to supplement on-the-ground monitoring. Their ease of use and affordability have quickly made UAVs valuable data collection tools for conservation, forestry, and other fields.
While raw images or video from a UAV can be helpful for getting perspective on the affected area, the team used Drone2Map for ArcGIS to process an array of nadir images captured above each study area into 3D data (i.e., point clouds, digital surface models) that provide valuable structural information.
The team at Powdermill’s GIS lab used 3D data from August 2015 flights to highlight the stark differences across salvaged, unsalvaged, and unaffected forest. Despite the potential value in using UAVs, several challenges were associated with applying traditional workflows, such as those built around lidar data, to photogrammetrically derived 3D data. For example, photogrammetry requires at least two common points between images. Lidar requires only a single ray to measure a feature or surface elevation, making it a much better choice to ground model, even with canopy coverage.
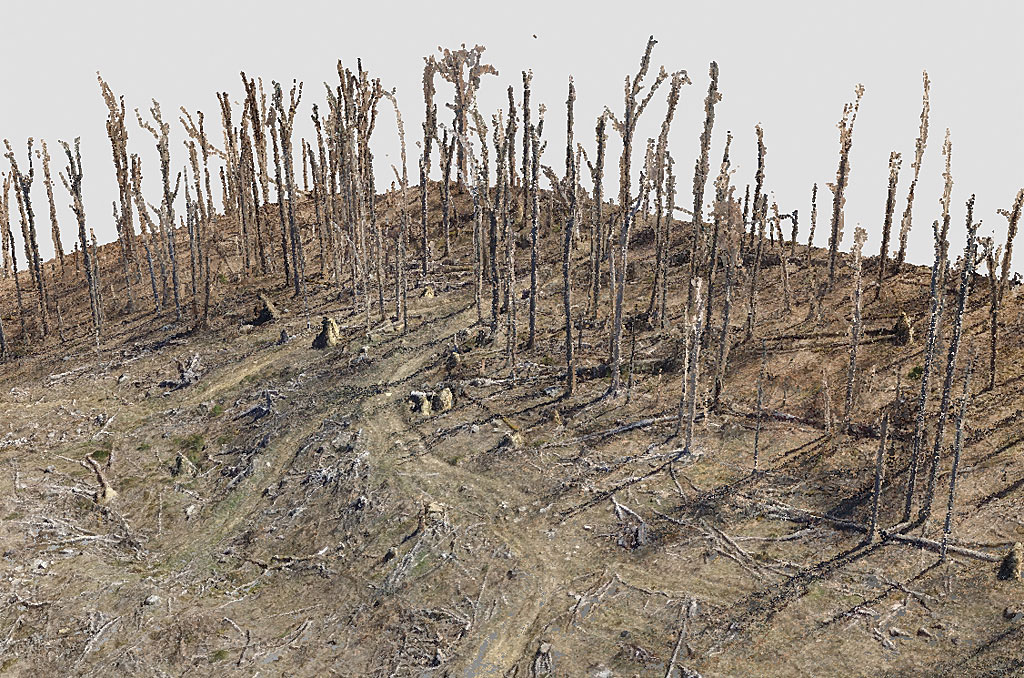
While testing a new UAV in preparation for summer monitoring, the team thought of a novel way to circumvent this major limitation. In deciduous forests, UAV imagery captured before the leaves emerge can provide a clear picture of both the ground and the trees below the canopy and be combined with the summer data to provide a more complete picture of the forest. The results obtained from processing these leaf-off images were surprising: a dense point cloud with nearly 1,200 times higher point density than the available lidar data. Individual trees were clearly visible.
Given the tremendous detail of this point cloud, the group sought to create a workflow to use this data for forest inventories that would automatically extract multiple forest parameters. Although methods for extracting trees from lidar point clouds exist in the scientific literature and are available through third-party software, the team wanted to explore using ArcGIS for Desktop with the ArcGIS Spatial Analyst and 3D Analyst extensions.
The logical starting point was the creation of a tool that would locate and identify each tree in the point cloud. To account for hilly terrain, the team converted the LAS files to a single point feature class and calculated point height above ground using a digital elevation model (DEM). [LAS is an industry-standard binary format for storing lidar data.] Because the best available DEM had comparatively coarse resolution, the team wanted to try classifying the ground points within the point cloud since the ground was clearly visible in the point cloud.
Integrating a New Data Type into Existing Workflows
Though the photogrammetric point clouds share the same file type and are similar in appearance to lidar, they are produced by different processes. Photogrammetric point clouds lack fields, such as return number, intensity, and class code, that are generally present in processed lidar data. Any tool that uses these lidar-specific fields may not function as expected when run on photogrammetric LAS files.
Consequently, the team—anticipating these difficulties—used the Classify LAS Ground tool available with the ArcGIS 3D Analyst extension on the unclassified point cloud. The tool often performed well, but it periodically left large areas unclassified. On closer inspection, the team found that unusually large surface anomalies often marked the start of unclassified areas. They found a workaround by first running the tool with a mask that excluded these difficult areas followed by a second run reusing ground points from the first run. Once the preliminary work was done, the team could begin extracting usable information from the dense cloud of points.
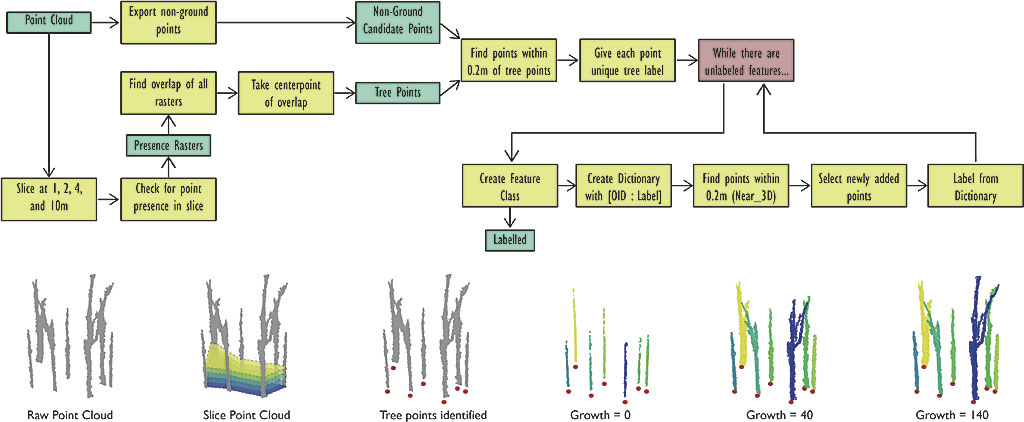
Many existing methods for delineating vertical features such as trees start by identifying a local maximum. This approach does not work well with deciduous trees that have large, sprawling canopies and several high points. Instead, the team identified each tree from the bottom up and took advantage of the tree’s vertical trunk. Since a tree trunk extends from the ground up to the canopy, unlike woody debris or other vegetation, the team sliced the point cloud into three height classes between 1 and 10 meters; rasterized each layer, assigning values of 1 for presence and 0 for absence to each cell; layered the three rasters; and used the Raster Calculator in the ArcGIS Spatial Analyst extension to summarize the cell values for all three layers. The result was a final raster in which all cells with a value of 3 represented tree locations and were converted to a tree point feature class.
At first blush, the results looked promising, but the team realized that a more rigorous accuracy assessment was necessary. Using the Create Random Points tool, they manually established 40 assessment plots totaling ~1.26 hectares (3.1 acres). Leveraging the linked map and scene capabilities of ArcGIS Pro, the team could inspect the point cloud and manually map each tree in the assessment plots. After this tedious work, the team was pleased to find that the custom tool accurately mapped the location of 97 percent of trees without additional fieldwork.
Seeing the Trees from the Points
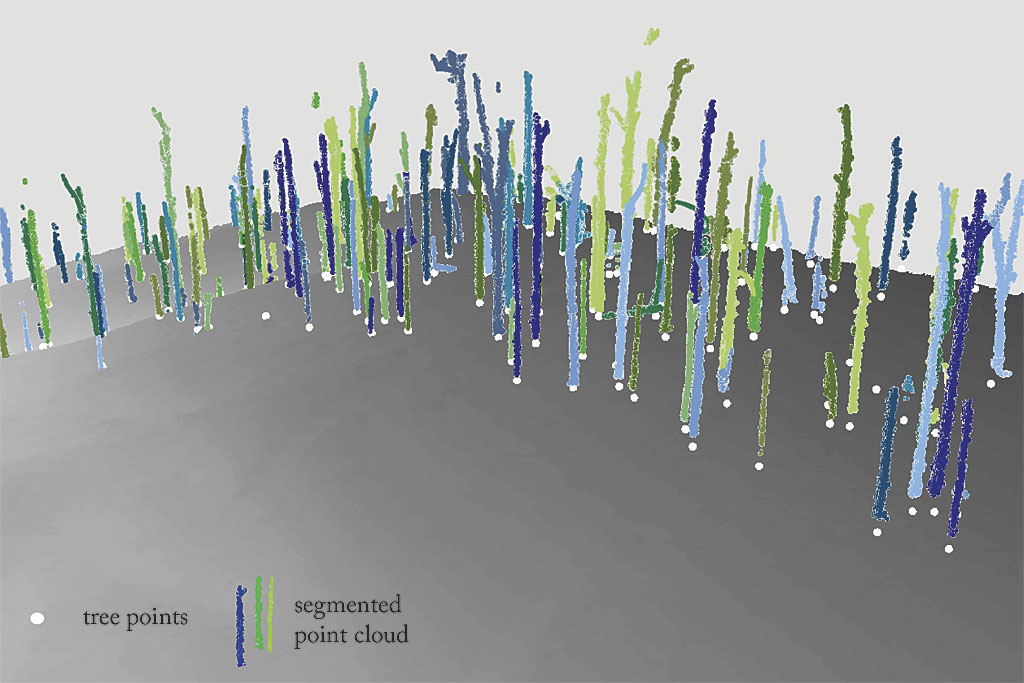
The accurate tree point locations, combined with a canopy height model, provided the team with tree location and height. However, the clear forms of the trees within the dataset suggested the possibility of extracting additional forestry parameters such as estimates of tree volume and basal area, so—bolstered by this early success—the team further explored the dataset.
Team members quickly realized that they were in for a challenge. Performing geoprocessing and making measurements on individual masses of points would require delineating individual trees from the mass of non-ground points. Manual delineation was out of the question due to the large focal areas (100+ acres/40+ hectares in total) and the small size of the team. Instead, they needed to come up with a series of logical steps to consistently delineate trees.
Initially, they considered assigning all above ground points to the nearest tree. This proved to be unsatisfactory because large, spreading tree crowns sometimes overlapped. While more computationally intensive, an iterative growth approach could circumvent this major issue.
After setting the starting point for each tree based on the previously mapped tree points, the team tried searching for above ground points in a small 3D envelope to allow each tree to “grow” only if there were additional points nearby. Unfortunately, a nearly continuous mat of unclassified points near the ground meant that the iterative loop would not stop at the base of the tree, even with a small search window.
To get around this problem, the team tweaked the tool to slice off all points within a meter of the ground before the loop started. After the iterative growth portion of the tool finishes, the low points are added back, and the trunk is extruded down to the ground. The level of complexity within the study area, characterized by a high density of debris that was leaning or downed after the storm, created low expectations that the tool could consistently delineate trees from the point cloud.
The team returned to the earlier assessment plots to manually delineate each visible tree in ArcGIS Pro and was pleased to find that for 315 trees (composed of 395,097 individual points), there was a 91.6 percent correspondence between the automatic tool and manual delineation. The results were even more encouraging after manual inspection, when they found that just 10 or so problematic trees resulted in many of the delineation errors.
Plans for Additional Development
After some ups and downs and many trips back to the drawing board, the team now has a custom set of tools that allows it to collect leaf-off imagery and process this into forest inventory data within a matter of days, which greatly reduces the manual fieldwork to collect this type of data. Moreover, saving the flight records to repeat the same flights in the future will allow all the project partners to monitor sitewide change over time in unprecedented detail.
While fieldwork will still be required, the UAV has quickly established itself as a valuable tool for the scientists studying this important land management issue. Seeing the value in these same approaches for other researchers and conservation groups, the team plans to share its work via a custom toolbox once the code has been cleaned up. The team also plans to push further with this technology, adding more multispectral sensors with repeat flights during the spring and fall seasons to attempt to classify individual tree species types in this diverse forest. UAVs certainly have the potential to revolutionize geospatial data collection, and—with some creativity—these tools and their resultant data can work well within the existing ArcGIS infrastructure.
For more information, contact Jake Slyder, GIS research scientist, at the Carnegie Museum of Natural History.
About the authors

Jake Slyder

Julia Carr