Did you ever wonder how expert analysts learned to analyze? How do chess grandmasters learn to think and plan their next move? They use a process. It may seem like analysis is something magical and hidden that happens in some people’s brains naturally. To a certain extent, we are born with our intellectual capabilities, but most of what an analyst does can be learned through techniques and methodologies.
First, we have to improve our observation skills. Think about how crime scene investigators (CSIs) approach a crime scene. They might use all their senses to collect information: sight, sound, smell, touch, and—in rare cases—even taste. If we observe precisely, we can compose the proper context for our observations.
The problem is that our brains seem to be hardwired to bring our attention to the expected patterns rather than the unexpected. To overcome this “curse of knowledge,” we have to train our brains how to analyze data and interpret what we see. The best way to become a better analyst is to use a systematic, sequential, and iterative thinking process. But what specific techniques should you use?
Benchmarking techniques are a great place to start. A term borrowed from surveyors, a benchmark is a point of known location and elevation. It’s a point of reference. A benchmark ensures that surveyors can return to the same point in the future and have consistency in their measurements. Without benchmarks, the exact location can’t be measured and understood.
In a business context, we also use benchmarks. The point of reference is a specific indicator such as sales per square foot. These key performance indicators (KPIs) allow us to evaluate and compare performance metrics over time as well as spatially. And more important, benchmarks help us find the unexpected in our data, which is the fun part of analysis. Each of the following scientific tools represents an analogy for the critical thinking process we can draw upon to analyze our data. We can create an intuitive approach to analysis and benchmarking techniques.
1 THE MASS SPECTROMETER
Scientists use a mass spectrometer to identify the individual components of a substance. In other words, to really understand something, you need to break it down into its individual parts. The useful thing about this technique is that once you have identified the parts, you can often begin to see patterns, groups, and subsets of different aspects of whatever you are studying.
However, no matter what your topic of study, make sure that you know what the whole is first. What is the total population or number of features? Then, see if you can break that whole into its parts and understand the percentage of each that makes up the whole. This will give you context and a point of reference that you can use to compare other groups, samples, or areas of interest.

2 THE TELESCOPE
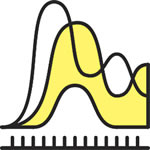
Most of us have looked up at the night sky and seen the Milky Way. This provides only one perspective of the stars. If we use a telescope, we can see the stars and planets in more detail. A telescope lets us see an individual star in the context of a constellation or even a specific type of galaxy. But this technique is not only about looking at your data at different scale levels. Underlying this technique is the idea that we need to expand our understanding by aggregating the data.
One technique that makes it easy to compare data at different scale levels is to use an index. For example, let’s say that from the mass spectrometer technique, we learn that our target population is 18- to 34-year-olds who make up 24 percent of the total population of the country. We can measure that same target population percentage at the census block group level, or by ZIP code, trade area, county, metropolitan area, or state level. By dividing each area’s percentage by 24 percent and multiplying by 100, we can create an index that compares any value to the base population percentage.
While it is relatively easy to remember a single benchmark like 24 percent, the value of converting all your variables to an index based on 100 is that you will be able to scan multiple variables and have an almost instant understanding of how any given area relates to the overall population based on an average, median, percentage, a target number, or a threshold value.

3 THE MICROSCOPE
In some ways, the microscope is simply the flip side of the telescope technique: drilling down to a small area with more details rather than aggregating data up to a larger geographic area. But the idea behind this technique is to validate assumptions or hypotheses that we may have made when viewing data at a higher level. If you only look at your data at an aggregated level, you may miss the specific variables that lead to unexpected conclusions that may change the way that you do business. So create a map series and zoom in to each location to check whether the patterns that hold true at a higher level need to be refined based on the individual characteristics of your data.

4 THE BALANCE SCALE
A balance scale compares a known weight to something that has an unknown weight employing a specific unit of measurement. It’s the idea of comparing and contrasting one thing to another using some standard of measurement.
One of the simplest ways to do this is to rank your data. It could be as simple as numbering the values from 1 to the highest rank or using a calculation in Excel such as the RANK.EQ or RANK.AVG functions to ensure that when values are the same, they are given an equal rank. If you rank your data, it makes it easy to create five classes in your map layer symbology to show the top 20 percent and bottom 20 percent of your data. In business, it is common to find that 80 percent of sales come from 20 percent of customers, or (stated more generally) 80 percent of the effects come from 20 percent of the causes. By ranking and classifying your data, it is easy to see which features are most important.

5 THE BLACK LIGHT
Scientists often use a black light to highlight an object or substance that is different from the area surrounding it. The black light emits long-wave ultraviolet (UV-A) light that causes some substances to glow or fluoresce. A black light acts as a filter that highlights an outlier that is not visible when viewing the substance under normal lighting conditions.
You should always look for outliers in your data. Outliers are important because they should cause us to ask questions about why they occurred. What is different about that data point, location, or value that makes it an outlier? When we ask more questions and add more data to our solution, we can sometimes gain insight that affects how we approach our original hypothesis.
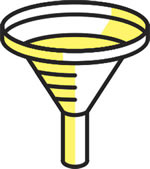
6 THE FUNNEL
A funnel is a simple lab tool that allows a scientist to pour different substances into a single container. For analysis purposes, we need to think about how we can combine and intersect our data. Doing this may prompt questions about what happened to create the convergence or correlation that we see in our data. If we are studying data over time, we might look for a change point or intersection to see if we can figure out what factors produced the change and why it occurred.
A good way to use the funnel technique in GIS is to aggregate data to equal-sized areas such as hex bins or grid squares. This helps us understand the density of our variables as well as identify areas with higher total values. This also makes it easy to combine multiple variables by using the Grouping Analysis tool in the Spatial Statistics toolbox or by creating a weighted score for each area based on the combination of multiple index values. In addition, we can use the standard geoprocessing tools to overlay multiple layers to find points of intersection between different datasets.

7 THE PETRI DISH
The Petri dish is used to culture organisms and watch how they change over time. If there is no change in a particular Petri dish, the scientist will try to identify why the change did not occur. For example, a scientist testing various disinfectant solutions to see which ones were better at preventing the growth of bacteria would look for changes in the Petri dishes that showed a decrease in bacteria.
In the same way, it is always helpful to try to understand our data from a historical perspective. Was the data always like this? If not, what changed? What was the rate of change as well as the total amount of change? Of course, you may not have historical data or a time variable in your data. If that is the case, you should make it your mission to start collecting and storing this data right now, because in several years, you will find that the data you collected will have significant value.

8 THE MIRROR
There are two ways that we can look at the mirror technique. The first and most obvious way is that we can use a mirror to look at the reflection of ourselves. It is often helpful to start from our own perspective or neighborhood and test that knowledge against the data that we have. Analytics is more meaningful to people when they understand the data within their own context. However, there is a danger in relying on our own point of reference. Many times, we think we understand our own neighborhood simply because we live there. This may introduce biases into our analytical process.
Mirrors also have an amazing ability to help us see things from a different perspective and to even see the invisible. Not only can mirrors let us see what is behind us but are also used in science to help us see things that we can’t see with our eyes. As example of this use of mirrors is Schlieren flow visualization, which uses parabolic mirrors, a light source, and a camera to capture a picture of the sound of a clap.
It is important to expand the scope of our analysis beyond our personal experience and add data points and variables to that which was previously known. The mirror technique encourages you to ask whether you have considered your problem from all perspectives. This may mean using substitute or proxy variables when the data that you want is not available. For example, using Esri Community Analyst with Esri Tapestry Segmentation Data, we can gain insight into demographic patterns that would otherwise be invisible.
WHAT’S YOUR PROCESS?
These ideas are not new. They were inspired by Ben Jones’s presentation “Seven Data Story Types,” which was (in turn) inspired by Christopher Booker’s book, The Seven Basic Plots: Why We Tell Stories. Many of you can add your own scientific tools to your analytics process. The list of tools described in this article is not comprehensive. The important thing to remember is to find a process that works for you.
If you are curious to see how I used these tools to analyze data and determine the best markets for craft beer and pizza in the United States, see the presentation I gave [PDF] at the 2016 Esri User Conference. For more information, contact Susan Zwillinger, principal consultant at 4CTechnologies.
About the author