In the aftermath of a natural disaster, response and recovery efforts can be drastically slowed down by manual data collection. Traditionally, insurance assessors and government officials have to rely on human interpretation of imagery and site visits to assess damage and loss. But depending on the scope of a disaster, this necessary process could delay relief to disaster victims.
The Woolsey Fire burned for 15 days, burning almost 97,000 acres, and damaging or destroying thousands of structures. Deep learning within ArcGIS was used to quickly identify damaged structures within the fire perimeter, fast tracking the time for impacted residents and businesses to have their adjuster process the insurance claims.
The process included capturing training samples, training the deep learning model, running inferencing tools and detecting damaged homes – all done within the ArcGIS platform. In this blog, we’ll walk through each step in the process.
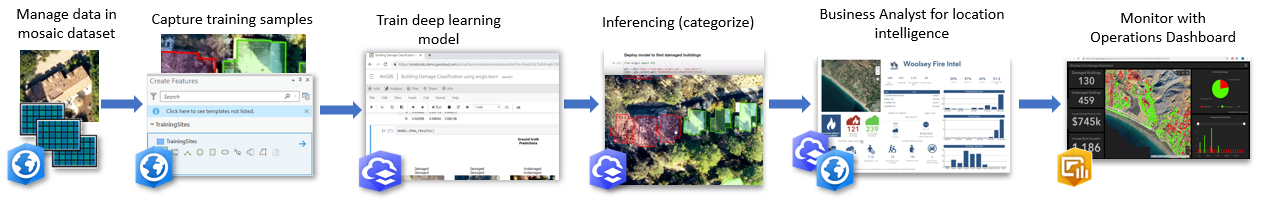
Step1: Managing the imagery
Before the fires were extinguished, DataWing flew drones in the fire perimeter and captured high resolution imagery of impacted areas. The imagery totaled 40 GB in size and was managed using a mosaic dataset. The mosaic dataset is the primary image management model for ArcGIS to manage large volumes of imagery.
Step2. Labelling and preparing training samples
Prior to training a deep learning model, training samples must be created to represent areas of interest – in this case, the USAA was interested in damaged and undamaged buildings. The building footprint data provided by LA County, was overlaid on the high resolution drone imagery in ArcGIS Pro, and several hundred homes were manually labelled as Damaged or Undamaged (a new field called “ClassValue” in the building footprint feature class was attributed with this information). These training features were used to export training samples using the Export Training Data for Deep Learning tool in ArcGIS Pro, with the metadata output format set to ‘Labeled Tiles’.

Step 3: Training the deep learning model
ArcGIS Notebooks was used for training purposes. ArcGIS Notebooks is pre-configured with the necessary deep learning libraries, so no extra setup was required. With a few lines of code, the training samples exported from ArcGIS Pro were augmented. Using the arcgis.learn module in the ArcGIS Python API, optimum training parameters for the damage assessment model were set, and the deep learning model was trained using a ResNet34 architecture to classify all buildings in the imagery as either damaged or undamaged.
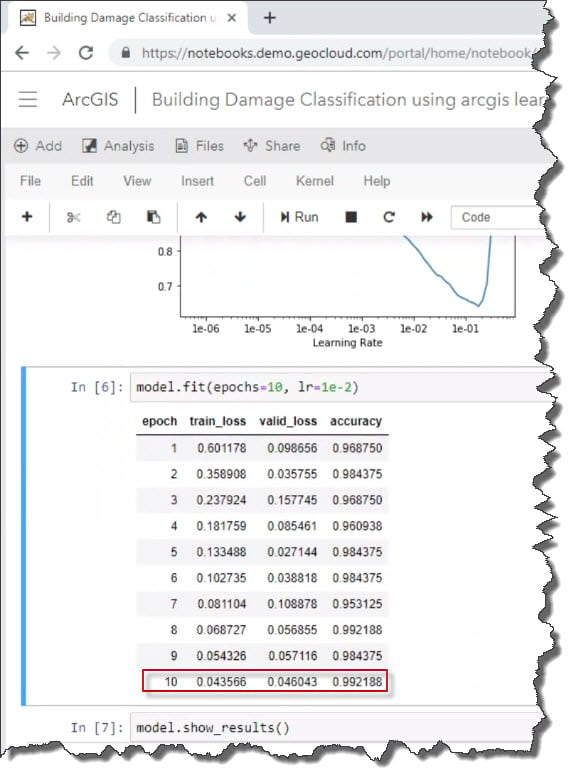
Once complete, the ground truth labels were compared to the model classification results to get a quick qualitative idea on how well the model performed.

For complete details on the training process see our post on Medium
Finally, with the model.save() function, the model can be saved and used for inferencing purposes.
Step 4: Running the inferencing tools
Inferencing was performed using the ArcGIS API for Python. By running inferencing inside of ArcGIS Enterprise using the model.classify_features function in Notebooks, we can take the inferencing to scale.
The result is a feature service that can be viewed in ArcGIS Pro. (Here’s a link to the web map).
Over nine thousand buildings were automatically classified using deep learning capabilities within ArcGIS!
The map below shows the damaged buildings marked in red, and the undamaged buildings in green. With 99% accuracy, the model is approaching the performance of a trained adjuster – what used to take us days or weeks, now we can do in a matter of hours.

Step 5: Deriving valuable insights
Business Analyst: Now that we had a better understanding of the impacted area, we wanted to understand who were the members impacted by the fires. When deploying mobile response units to disaster areas, it’s important to know where the most at-risk populations are located, for example, the elderly or children. Using Infographics from ArcGIS Business Analyst, we extracted valuable characteristics and information about the impacted community and generated a report to help mobile units make decisions faster.

Operations Dashboard: Using operations dashboard containing enriched feature layers, we created easy dynamic access to the status of any structure, the value of the damaged structures, the affected population and much more.
Summary:
Using deep learning, imagery and data enrichment capabilities in the ArcGIS platform, we can quickly distinguish damaged from undamaged buildings, identify the most at-risk populations, and organizations can use this information for rapid response and recovery activities.
More Resources:
Distributed Processing using Raster Analytics


Commenting is not enabled for this article.