Military intelligence analysts, especially those stationed in a war zone like Afghanistan, must think and act quickly to turn raw data into actionable intelligence.
They often turn to GIS tools to do their work, including the Multiple Ring Buffer tool in ArcGIS Pro. This tool, for example, can create the buffers needed to illustrate the distances that a wide variety of rocket types on the battlefield can travel.
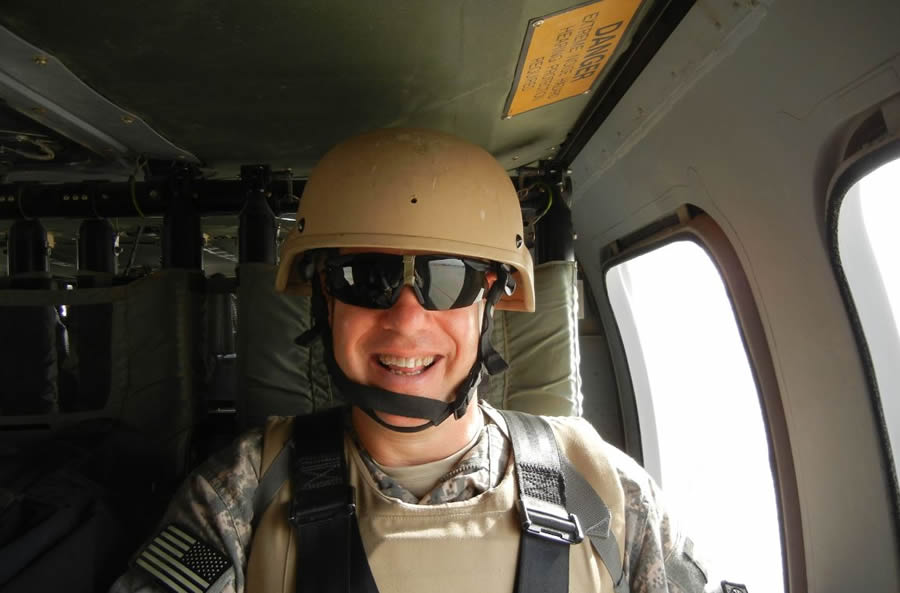
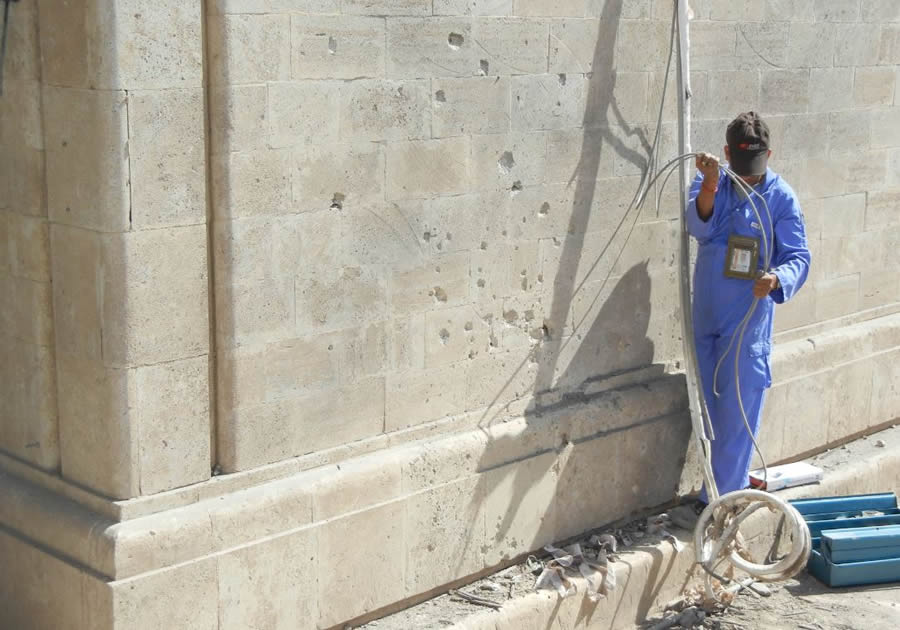
This is the kind of analysis I did in 2011 when, while serving as a military intelligence analyst at Bagram Airfield in Afghanistan, my base was suddenly hit by a rocket fired by the Taliban. Back then, ArcMap was my go-to GIS application. Now, if I were stationed in that war-ravaged country today, I would use ArcGIS Pro as my app for battlefield analysis.
Reports indicated that the rocket didn’t kill anyone. Regardless, the commanders of my United States (US) Army’s 1st Cavalry Division still wanted to learn where the rockets had been fired from amid the 14,000-foot Hindu Kush Mountains surrounding the Bagram area.
Battlefield technology often detects a rocket’s launch and impact points. When that occurs, my fellow military intelligence analysts in the 1st Cavalry Division go through an established set of procedures to identify and locate the attackers.
You always know where a rocket blows up—often, you can hear it. But technology does not always capture its launch point, as it failed to do on that night. Nevertheless, we were told to try to track where the rocket was fired from.
I scrambled to solve what was essentially a geographic question.


I work for Esri in Redlands, California. But that summer, I was a mobilized member of the US Army Reserve, two months into my combat tour inside Afghanistan. At Esri, I had gained some experience with commercial off the shelf (COTS) geoprocessing tools. These tools can turn raw data into actionable intelligence.
During that midnight shift in 2011, while I was tucked safely inside my work bay in an old Soviet hangar, a voice over the loudspeaker blurted out the coordinates of the rocket’s impact point. I wrote them down and fired up ArcMap in ArcGIS for Desktop.
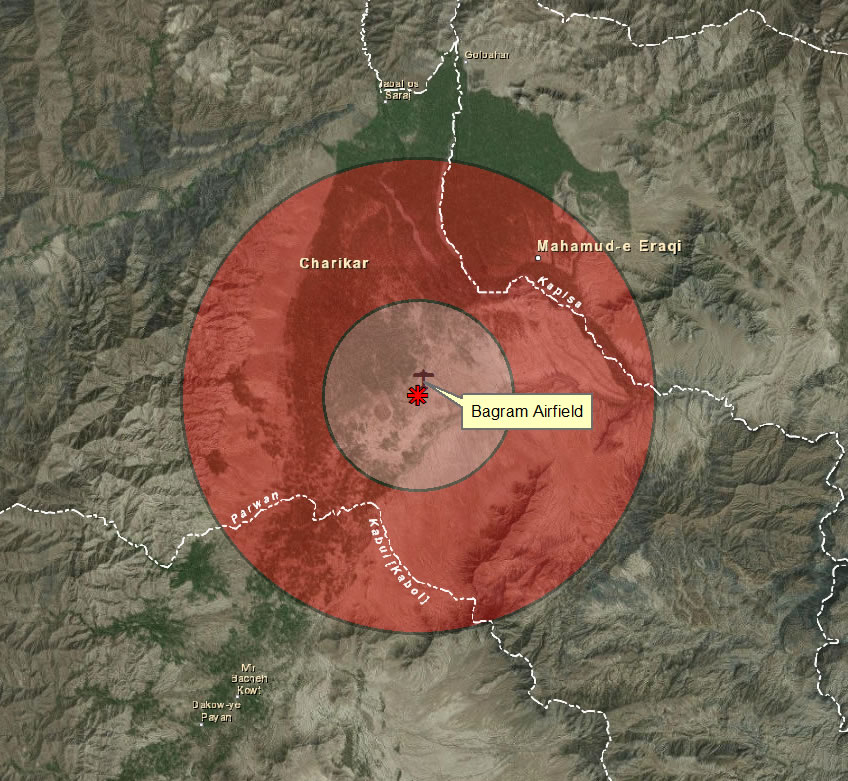
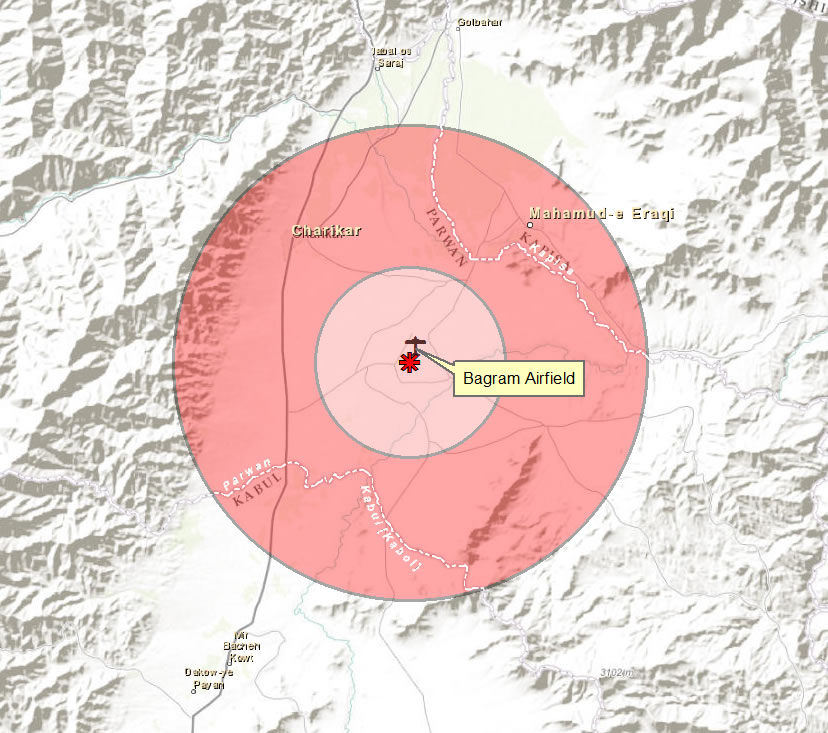
My map of Afghanistan was already made, so I had only to create a point feature of the impact point and open the Multiple Ring Buffer tool. This geoprocessing tool can be used to show the maximum distances that a weapon, such as a rocket, can travel.
I based my range rings on buffers of 8 kilometers and 20 kilometers. Those distances are the typical ranges for 107 mm rockets, which have a maximum range of 8 kilometers, and 122 mm rockets, which have a maximum range of 20 kilometers. The larger the caliber, the farther the rocket can travel.

The Taliban never emailed Coalition Forces about the attacks in advance, so I had to make some assumptions about the caliber of the rockets commonly used on the battlefields of Afghanistan.
I took a snapshot of the semitransparent range rings over a basemap of the mountainous terrain surrounding Bagram Airfield. By imposing the rocket range rings over the rugged terrain, analysts might be able to identify the corridors where the insurgents may have traveled to fire their rockets and escape detection.
I dropped the image into a PowerPoint presentation and emailed the slide to the busy battle captain, who responded with a simple “Thanks.”
And that was it. I never heard whether or how the information was used. And I’m not surprised. In my war zone experiences, information is inhaled like a vacuum sucking pebbles. The information disappears, and you seldom hear about its impact.
Regardless, I was just happy that, because of my knowledge of GIS, I could contribute to the ongoing fight in an unexpected way.
Like many veterans, I love retelling my war stories. But unlike most veterans, I write ArcGIS tutorials for Esri, so I was able to recall and expand on my rocket attack experience to create the Actionable Intelligence tutorial, which you will find published here.
Berry has worked for Esri since 2009. He continues to serve as a chief warrant officer in the US Army Reserve.
