The United States Department of Agriculture US Forest Service (USFS) uses GIS technology to monitor America’s forests and ensure they will remain vital and healthy for generations to come.
USFS foresters rely on Esri’s GIS technology to support many types of work, including fighting forest fires, issuing burn permits, harvesting trees or replanting them, building trails, or protecting wildlife.
In the USFS Forest Inventory and Analysis (FIA)program, employees use ArcGIS, Esri’s GIS platform, to create reports about the status and trends of the nation’s forests and show the information on a map. The inventory is a census of tree species, size, and location. It is a health report describing tree growth, canopy, mortality, land-use change, and insect infestation. It is also a business report about wood production, use rates, and landownership.
“Geospatial tools help the US Forest Service tell the story of America’s forests in ways that help people better see and understand what is happening,” said Richard Guldin, director, Quantitative Sciences, US Forest Service, Research and Development. “FIA geospatial products are available to interested citizens, foresters, and policy makers.”
These products include a variety of reports and analyses at state and regional levels as well as information from the FIA monitoring program. They are publicly available through the online FIA database. (FIA developers have also designed web GIS tools for users to analyze timber production and preprocess vegetation data for the FIA inventory.)
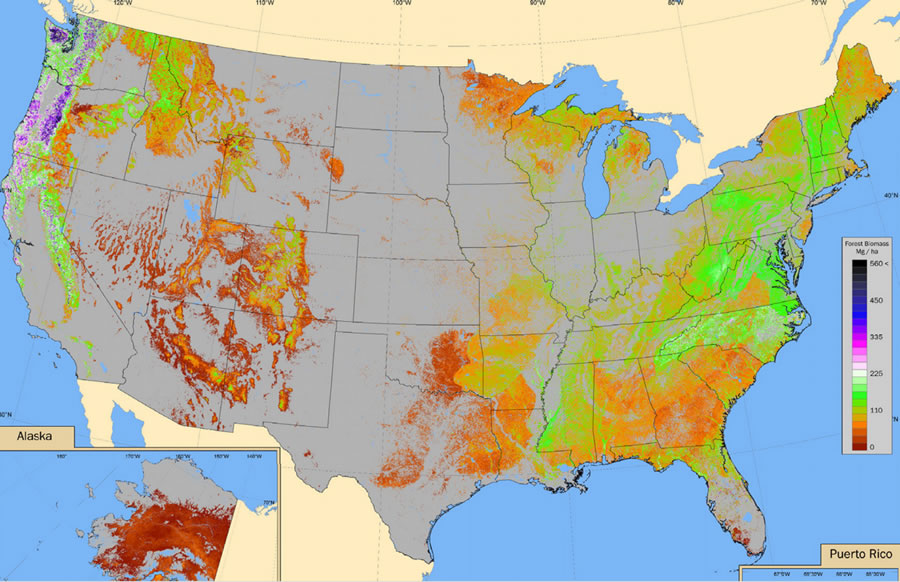
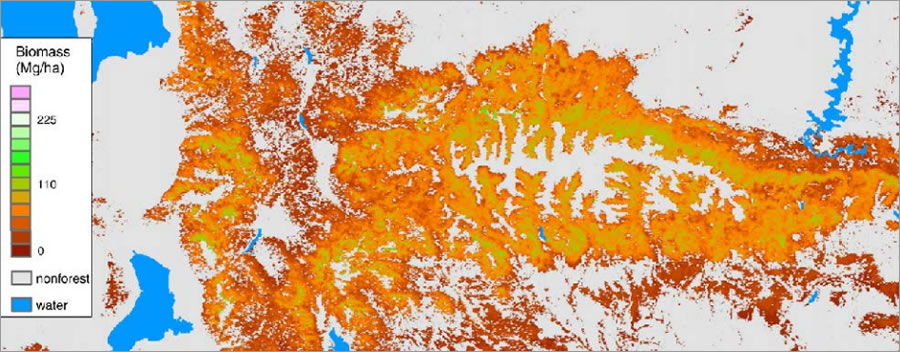
The basic forest inventory includes a satellite forest map product produced at a 250-meter scale. FIA developers and partners are now working on a forest map at the 30-meter scale level. The map is based on information from more than 300,000 FIA field plot samples spanning the United States.

In addition, USFS field crews collect sample forest health data such as vegetation and soil types, tree and crown conditions, and ozone damage. FIA researchers classify forest and nonforest lands to show rates of land-use change and where forests have been fragmented by human activity. The inventory also includes rates of land-use change. FIA teams also estimate timber mill production.
Among its forestry products is an insect and disease portfolio that includes data and maps about the risk and prevalence of two dozen different insects and diseases that attack trees. Biologists also use FIA data to map endangered species habitats, identify forest areas in decline, and track how the distribution of species is changing.
Forest researchers analyze FIA data layers, such as land cover, grasslands, and canopy density, to find new opportunities in the forest for revenue, conservation, and stewardship. Industrial analysts and private forest owners use the FIA layers to understand market trends such as wood supply.
Large-scale enterprises also use forest census information. For example, a utility company used the inventory data to locate biomass so it could build a thermal energy generation site. Another company used the inventory to see where timber was available for building a large-scale electrical generation facility. Major forest product firms across the United States use FIA data to study supply chain issues and make investment decisions in industries such as paper manufacturing and thermal energy production.

Forest inventory data is also used by small-scale ventures. For instance, managers for a major distillery were looking for an area where the company could make quality white oak barrel staves. They found just the right site, built a barrel stave sawmill, and created more than 25 jobs in a nearby rural town.
The National Aeronautics and Space Administration (NASA) recently worked with FIA to map tree cover and forest change. By using Landsat imagery and inventory data, researchers analyzed the role of forest dynamics in maintaining carbon balance.
Atlas of the United States is yet another FIA project. It explores questions about the value of American forests and the challenges that confront them. In addition, FIA is publishing the project’s data layers as a web service. The content comes from many data providers and includes links to their data repositories such as ArcGIS Online.
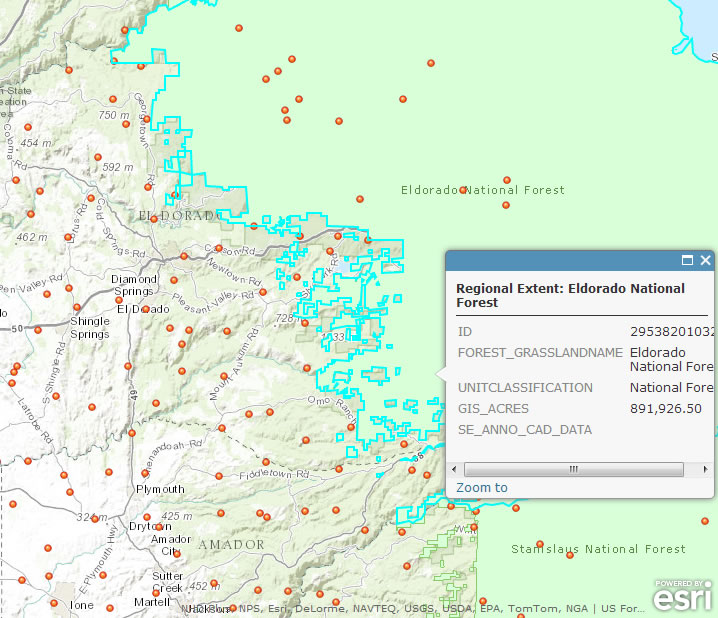
FIA publishes its inventory data by individual state and territory as CSV and ZIP files. ArcGIS users can upload and link to this data, located in the DataMart via the FIA database.
(Watch the video from Guldin’s talk at the 2013 Esri Forestry GIS Conference.)
