Before and after Hurricane Irma pummeled Florida in September 2017, staff in the City of Fort Lauderdale’s Emergency Operations Center (EOC) turned to GIS technology to prepare for and respond to the damage caused by the storm’s high winds and heavy rains.

Traffic moves smoothly on a sunny day in Fort Lauderdale. Photo courtesy of the City of Fort Lauderdale.
Fort Lauderdale’s GIS Division, which operates under the Information Technology Services Department, conducts annual assessments of the city’s emergency response needs. This includes studying how those requirements can be met using GIS. This annual assessment has led the GIS Division to implement GIS solutions based on Esri technology, with most being configurable applications. One of the division’s goals is to get the apps in place and tested prior to the start of hurricane season, which occurs from June 1 to November 30 each year. But as Hurricane Irma demonstrated, Fort Lauderdale must be able to respond quickly to severe weather incidents, as no two events are guaranteed to be the same.
Esri’s configurable application templates gave the GIS Division this agility when its staff was asked to deploy several new applications to meet the specific needs of the hurricane response efforts. The GIS Division augmented its preestablished inventory of emergency response-related applications by configuring several Esri templates several days before Hurricane Irma struck Florida and by making modifications shortly after the hurricane made landfall.
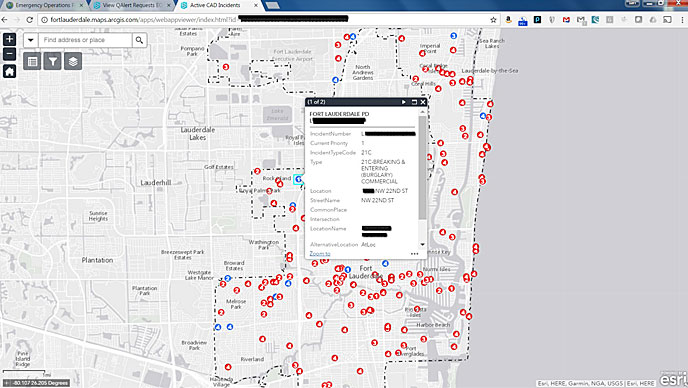
A web-based application, developed using Web AppBuilder for ArcGIS, provided the EOC with real-time, map-enabled fire-rescue and police calls for service from the 911 dispatch system. Fire-rescue calls are represented as red points on the map, pictured above, while police calls are symbolized as blue points. The symbols include a number to identify each call’s priority rating, with 1 being the most severe and 4 being the least severe.
By map enabling the 911 dispatch system in this way, command staff gained greater insight into storm-related incidents, such as two cases of breaking and entering commercial properties that occurred before the storm.
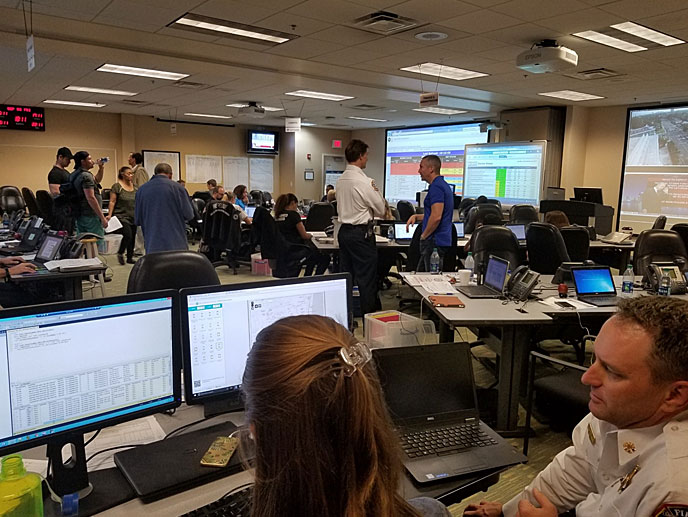
In the photograph above, a member of the city’s fire-rescue command staff works with a GIS analyst to make changes to one of the web applications.
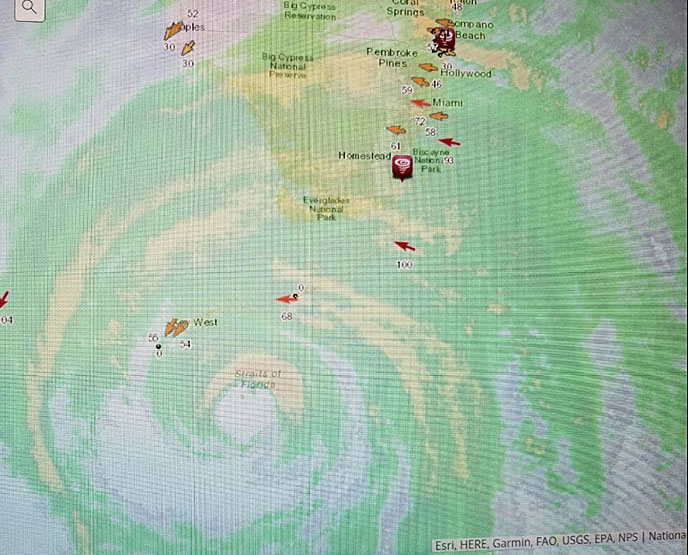
National Oceanic and Atmospheric Administration (NOAA) storm, tornado, and wind report web services helped fire-rescue and police command staff gauge when and where it was safe to send first responders out to address calls for service. Some classes of vehicles in each department’s fleet were better able to withstand high winds, so that was considered when determining how to handle a call for service.
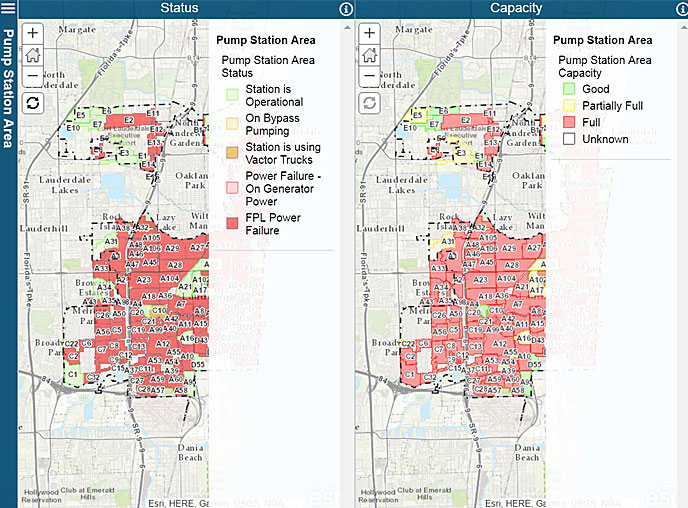
As the storm progressed, managers and supervisors in the Public Works Department, along with other city leaders, needed to know the status and capacity of the sewer pump stations. The maps pictured above show sewer pump stations and the area being served by each station. The pump stations move wastewater in the correct flow direction. If wastewater doesn’t move, there is the potential for sewage backup. In extreme conditions, such as a major storm, precipitation and floodwater have the potential to penetrate the wastewater system through surface-level manholes. Excessive water penetration into areas where pump stations are malfunctioning could result in sewage backups that seep onto the surface.
Utility workers with access to the supervisory control and data acquisition (SCADA) system entered pump station status and capacity information into an application configured by the city’s GIS team using the ArcGIS Online Basic Viewer template. Staff at the EOC and utility managers around the city were kept abreast of the situation through the use of this viewer application, pictured above. During the hurricane, the colors on the map changed from predominantly green to red. Green indicates that the pump stations are operating perfectly, yellow means they’re operating at less than an optimal level, orange means they’re approaching failure, and red means they’ve completely failed.
If city staff observe that the pump stations are operating far below optimal levels when the weather is good, the Public Works Department can easily remedy the situation. Crews are usually sent into the field to strategically shut off select valves in one area of the system. This action diverts pressure from one area of the system to another area that needs more pressure. But during a major storm, it’s often dangerous for crews to be out in the field. In these instances, Public Works staff can remotely power down targeted pump stations. During Hurricane Irma, the decision of which pump stations to shut off was made by looking at the status and capacity of all pump stations in the system. Essentially, the operation of one pump station affects the operation of other pump stations. The web application that showed the status and capacity of each pump station helped the supervisors, managers, and directors in Public Works determine which pump stations to power down.
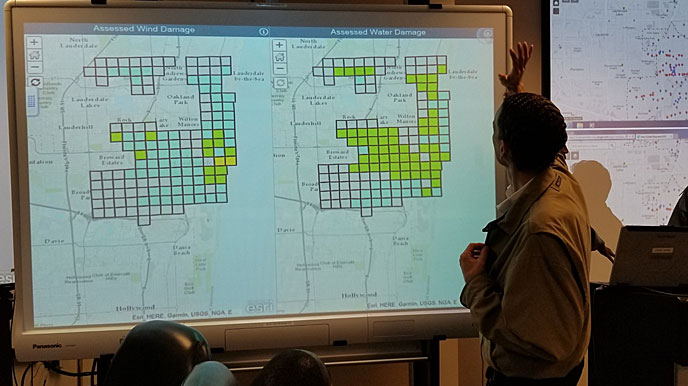
Poststorm activity started at the crack of dawn, with fire prevention and building inspectors conducting a rapid impact assessment of the entire city. Decision-makers in the EOC are granted access to the real-time status of the assessments by way of the ArcGIS Online Map Viewer.
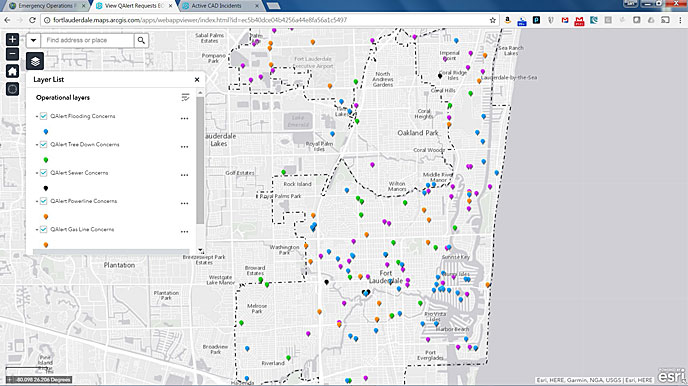
A storm as powerful as Hurricane Irma leaves behind an abundance of hazards such as flooding, trees down in roadways, and downed power lines. These issues were reported by Fort Lauderdale residents as well as city staff performing damage assessments or going about their business.
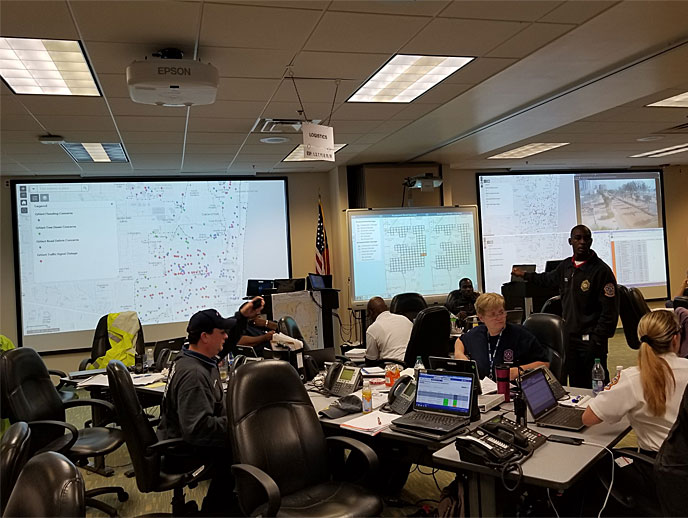
Different departments within the EOC are interested in tracking different activities using the configurable apps. In the photograph above, the map on the large screen on the left showed first responders the areas where there were flooding problems, downed trees in roadways, and traffic light outages. This information was of interest to the staff in the Public Works and Parks and Recreation Departments because it identified debris issues and concerns associated with utility assets. The map in the middle of the photograph displayed the progress of the rapid impact assessment (conducted when deemed safe during severe weather events) and was of interest to just about everyone on the city staff. The map on the right shows the fire-rescue and police command staff monitoring the current calls for service and viewing surveillance footage.

Staff in various departments and work units can focus on their particular concerns by using the web application pictured above, which was embedded in an Esri Story Map Series app that city staff calls the Emergency Operations Portal. They can track Open (red), In-Progress (yellow), and Closed (green) statuses of the issues pertinent to their area of the response.
Fort Lauderdale’s emergency preparedness and disaster response have become increasingly dependent on technology in recent years. GIS is at the forefront of that technology dependence, as made evident in the hours leading up to Hurricane Irma and at the start of the recovery effort. Those were periods when the large electronic displays in the EOC were dominated by interactive GIS applications. This point was underscored an hour into the start of the recovery effort on September 11, when EOC occupants requested that all seven screens in the EOC display GIS applications.