
September 15, 2017 |
February 18, 2020
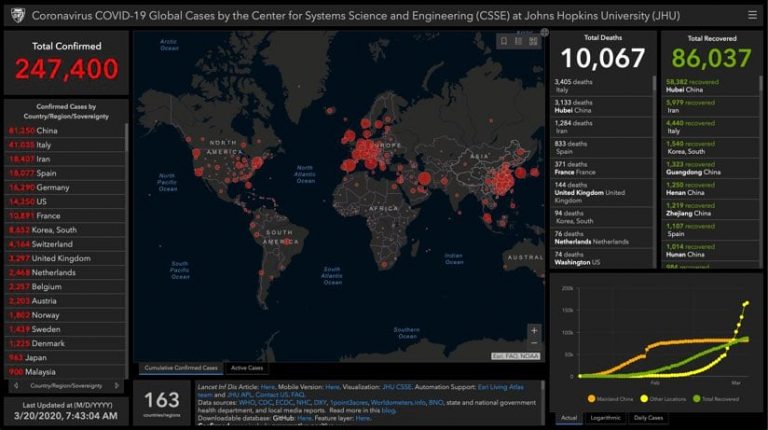
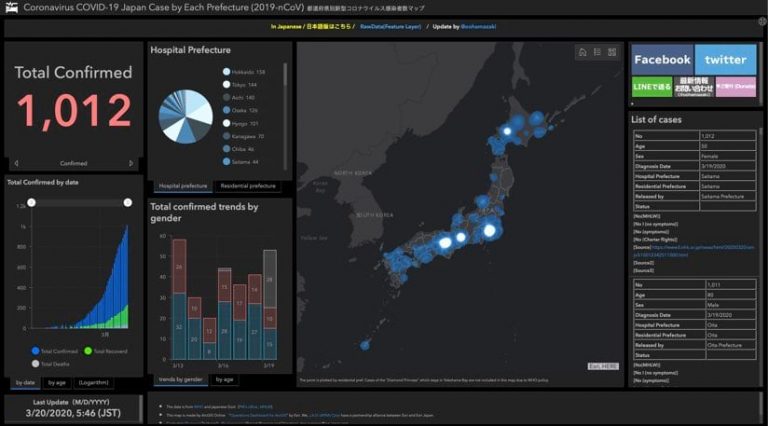
As pandemic fears escalated in late January, Johns Hopkins University published its now-famous coronavirus dashboard—a map-based tool developed to track and fight the spread of the disease now called COVID-19. Developed by Lauren Gardner and her team from the University’s Center for Systems Science and Engineering, the dashboard went viral almost instantly with hundreds of news articles and shares on social media and hundreds of millions of page views.
While it’s clear the dashboard—with real-time information about the global health emergency—is immensely popular, it takes some analysis to understand why.
The healthcare community has used maps to understand the spread of disease for a long time, most famously in 1854 when Dr. John Snow connected location and illness with his history-making map of a London cholera outbreak. From disease atlases of the early 20th century to more recent web mapping of Ebola and Zika scares, healthcare professionals have long considered mapping, and more recently geographic information systems (GIS), a critical tool in tracking and combating contagion.
One of the greatest challenges in the war against disease is humanity’s increasing mobility. Today, a person can pick up a virus in one place and share it to any other location on the planet within hours. Among the jet set, there’s the potential to become a super spreader, infecting a large number of people across a large geographic area.
This level of mobility places scientists at a serious disadvantage in slowing potential epidemics. While technology to create vaccines has become incredibly advanced, it still takes months to formulate an effective vaccine for a new virus. In those months, the virus can easily reach every corner of the world.
When disease can travel so quickly, information has to move even faster. The intense response generated by the Johns Hopkins’ dashboard shows how eager people around the world are to track health threats. The dashboard presents targeted, up-to-date information needed to understand the progress of a disease, and makes it available in a public, easy-to-digest format. Anyone across the globe with access to the internet can learn, in a few short clicks, a tremendous amount about the novel coronavirus and COVID-19 disease.
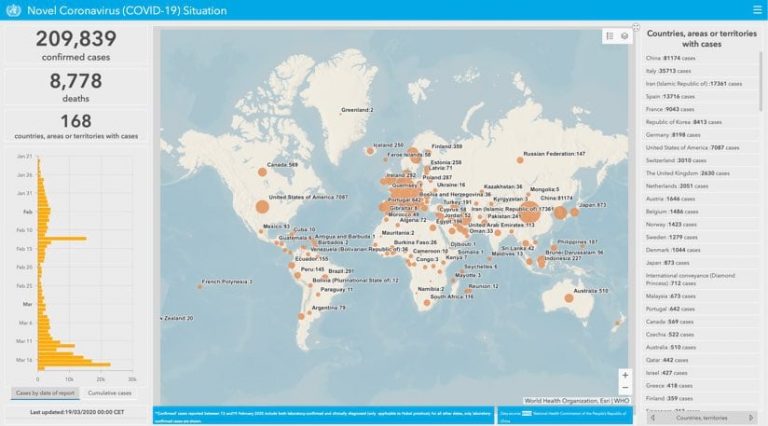
The dashboard’s interactive map includes the number of confirmed infections, fatalities, and recoveries, and where they happened. Graphs detail the progress of the virus over time. Viewers can also see the day and time of the most recent data update and review the data sources used to produce the dashboard.
Five authoritative sources selected by Johns Hopkins for the effort include the World Health Organization, the Centers for Disease Control and Prevention, the National Health Commission of the People’s Republic of China, the European Centre for Disease Prevention and Control, and the online medical resource DXY.cn. The Johns Hopkins dashboard provides links to these authoritative sources where viewers can learn more.
Web services allow GIS users to easily ingest and display disparate data inputs without having to host or process the data centrally. This eases data sharing and speeds the aggregation of information for improved understanding.
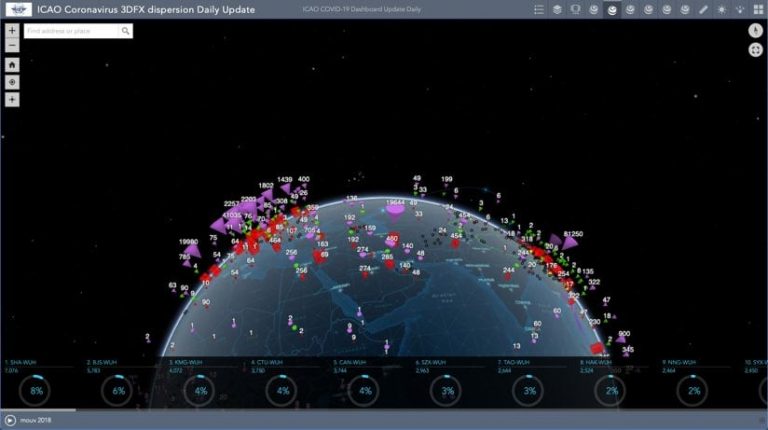
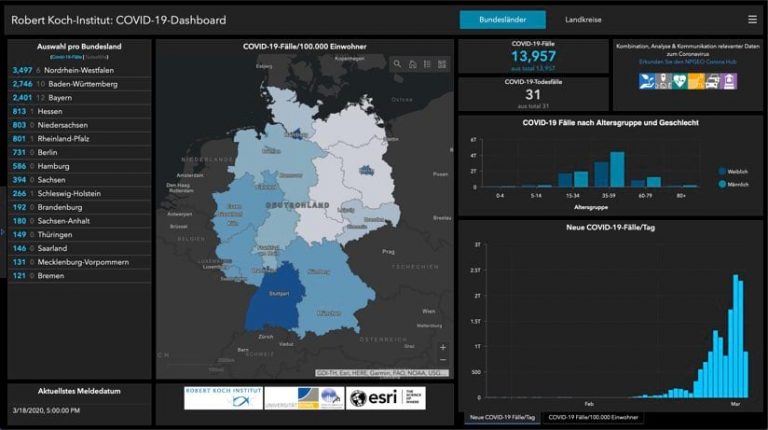
In the short time since the release of the Johns Hopkins dashboard, other organizations have been quick to use GIS technology to address similar needs. The resulting dashboards share some of the same details, customized with additional information to serve specific audiences.
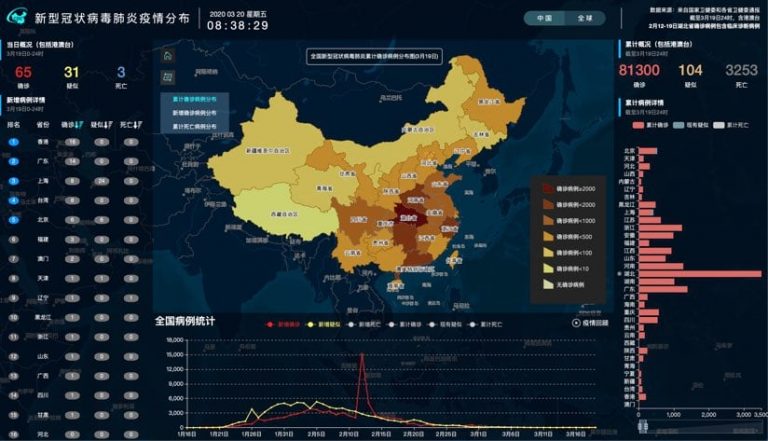
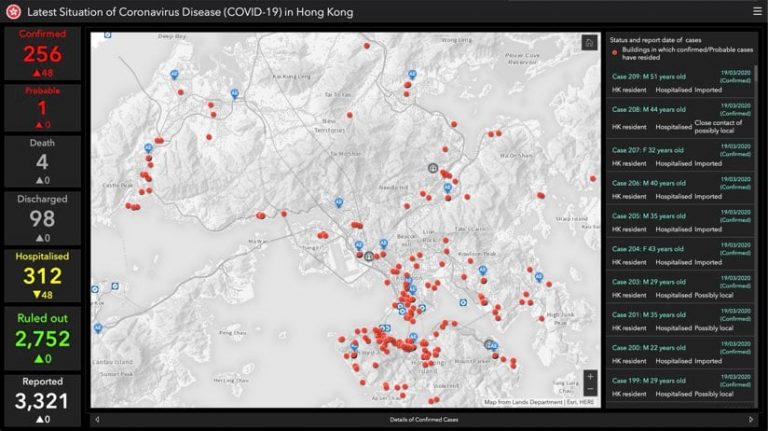
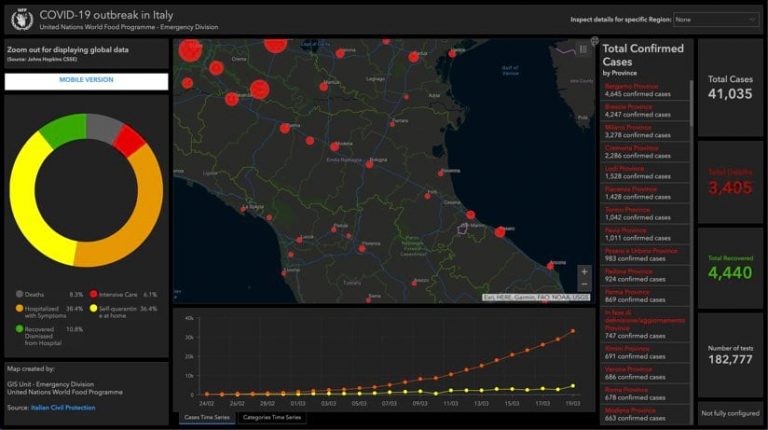
Several of these tools, like the one created by Johns Hopkins, include a mobile-optimized version, which makes the dashboards more versatile and accessible to the public on phones or tablets.
In the future, one could imagine dashboards being used to direct citizens of affected areas to the locations of crucial aid and resources. Dashboard maps could identify hospitals with available beds, clinics offering medical aid along with the current wait times, grocery stores and pharmacies that are open, where to purchase personal protective equipment, and so on. In heavily impacted cities, this kind of information could critically improve outcomes and save lives.
Another factor affecting epidemics like the Novel Coronavirus (COVID-19) situation is the calendar. During the Ebola and MERS scares of 2014, many people were faced with the prospect of canceling their trips to participate in Hajj, a six-day pilgrimage to Mecca made by more than two million Muslims every year. Equipped with days-old data and rumors, many faithful made the choice to take the chance and proceed with their pilgrimage, putting themselves at risk of contracting potentially deadly viruses and further spreading disease when they returned home.
Similarly, in the current coronavirus outbreak, Chinese New Year celebrations posed a threat as the themes of togetherness and reunion trigger the largest human migration in the world. China chose to push back the start of the Lunar New Year holiday to reduce mass gatherings, a public health intervention called social distancing. Travelers worldwide have subsequently been restricted from entering the country. With access to current information, authorities in Beijing, Macao, and Hong Kong made the difficult decision to cancel many major festivities entirely.
Future disease dashboards could incorporate the locations of scheduled cultural events and celebrations to accurately reflect the associated risk to travelers and enhance public health decision making. By bringing together location and time-sensitive events in relationship to a spreading disease, officials have the potential to reduce exposure and spread.
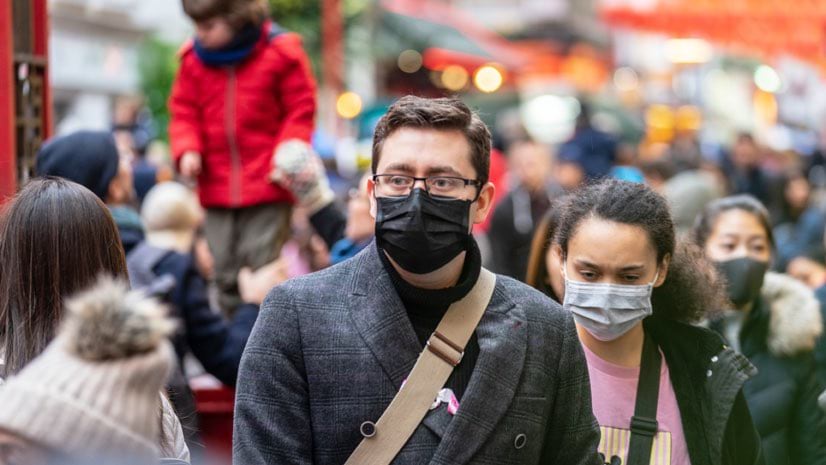
The arrival of the novel coronavirus (COVID-19 disease), like pandemics in the past, has impacted the way people travel, the way people feed themselves, and the economy.
As human mobility spreads the coronavirus at an unprecedented pace, outbreaks bring affected communities to a standstill, and anxiety stretches across the globe.
The public health community is hard at work finding new ways to combat the current threat while the medical community rallies to provide treatments and find cures. The availability of real-time, map-based dashboards have a role to play in informing all of these actions. This method of communication provides accessible, easily understood information to people around the world eager to protect themselves and their communities. This tool improves data transparency and helps authorities efficiently and effectively disseminate information to improve awareness about quickly spreading diseases.
Learn more about the use of GIS for health and human services. The Coronavirus Disease (COVID-19) GIS Hub includes a catalog of GIS data to support mapping and analysis, and to increase community preparedness. If you’re looking for ways your GIS department can prepare, here are details to help you respond to COVID-19.

With growing awareness of the interconnectedness of the health of people, animals, and the environment, a collaborative effort is underway across disciplines to define and monitor One Health. This eco-medical approach to wellness and conservation promotes a holistic view of health. Reaching back as far as 400 BC, when Hippocrates wrote his text On Airs, Waters, and Places, this philosophy acknowledges that the wellbeing of humanity is inextricably linked to, and impacted by, the condition of animal life and our natural environment.
The span of One Health includes the effects of pollution, global warming, and zoonoses (viruses that can pass from animals to humans, including Ebola, HIV, COVID-19, and some influenza strains). Geography is an integral component of this next-level understanding of world health, taking into account the increase of global travel, accelerated deforestation, and human expansion that result in increased opportunities for diseases to spread from person to person, and from wildlife to humanity. One Health combines the collaborative efforts of medical professionals, veterinarian specialists, and ecologists to address threats facing any one, or any combination, of these three facets of life on our planet.

September 15, 2017 |

June 27, 2019 |
May 30, 2019 |