

June 2, 2020 |
July 9, 2020
At the US Centers for Disease Control and Prevention (CDC), a new effort is under way to assist states in creating or enhancing localized COVID-19 dashboards and maps for the public.
“There’s a real demand for dynamic visualizations of all kinds of data in all of our emergency responses, and particularly in this one that’s affecting every US community but in a way that differs across the country,” said Debra Lubar, deputy director of management and operations for the National Center for Emerging and Zoonotic Infectious Diseases at CDC.
The path of public health data goes from local to state to national levels, with state authorities aggregating details from their local colleagues. With high demand for local information about the spread, CDC focuses on helping states communicate those data with the public. Dashboards displaying data and maps to convey COVID-19 case locations and counts have become the standard for communicating status and trends in the global pandemic.
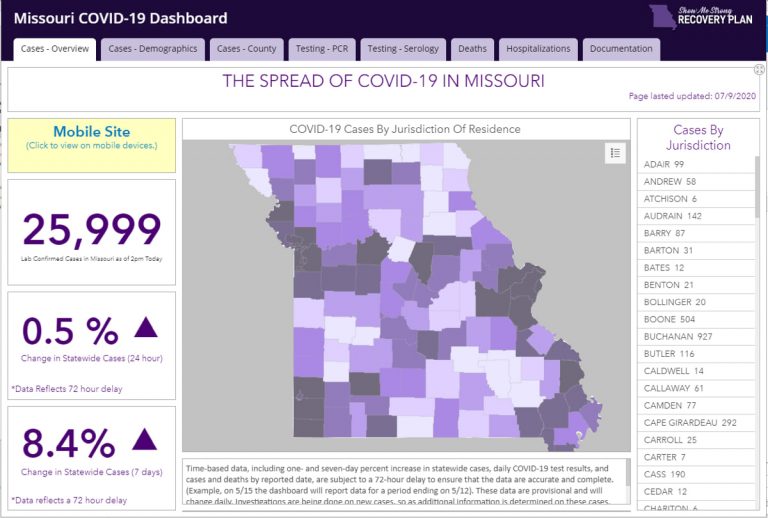
“There are critical data elements that are really important for people to see about their communities, where their families live, or places they plan to travel,” Lubar said. “Several states, such as Missouri, have developed dashboards that are good examples of how data can be made available and useful to the public.”
CDC has close partnerships with state public health agencies and issues grant awards to assist with internal data collection and disease surveillance. The current and ongoing effort with states has a different, more external focus, aiming to help them deliver data to residents, civic leaders, and public health administrators.
“We’ve seen that many states, including New York, South Dakota, and South Carolina, have been communicating effectively with the public, providing substantial granularity and transparency,” Lubar said. “CDC will continue providing support that will help states improve these efforts. We’ve worked to ease their participation, in part by recognizing that different states may have different needs.”
Like the disease, much is new about the effort to get cutting-edge technology into the hands of state public health professionals so they can display their own data. “CDC is providing access to tools and funding to state health departments that are leading public health actions in response to the pandemic,” Lubar said.

While the work isn’t centered on standards or mandates, the CDC has shared best practices and guidance based on the kinds of questions it has been fielding. The basic data points include case counts, case rates, and recent trends for cases, deaths, hospitalizations, and testing. “We’ve also encouraged states to add relevant demographic data, such as racial, ethnic, gender, and age information,” Lubar said.
Armed with this information, states and localities will be better equipped to monitor the impacts and mitigate risks, and federal resources can go where they are needed most, because everyone will be working from the same data.
Counting and reporting details about each COVID-19-infected person presents new challenges for public health officials. Apart from exceptions such as foodborne illnesses and influenza, most infectious diseases in the modern era have low case numbers and outbreaks have been rare events with limited scope.
An outbreak involving the food supply can impact thousands of people, and each case is counted. Most outbreaks have been quickly investigated and halted. Influenza, on the other hand, impacts millions of people per year. In this case, a combination of surveillance and scientific methods can be used to reliably estimate the impact and outcomes instead of counting each case.
“The way we’re tracking this disease is really different,” Lubar said. “Our systems have to grow and flex to accommodate a pandemic where it’s important to know about each case and be able to trace the contacts.”
Better information about the location of cases has also taken on greater importance.
“Understanding where cases are occurring is critical to understanding how disease is spreading,” Lubar said. “New technology, combined with the globalization of the world population and trade, have really showed us new ways that diseases spread. Spatial analysis is critical to that.”
CDC also uses mapping to monitor the spread of disease at the county level and reaches out to states to offer assistance if they detect a spike in the number of cases.

CDC contracts with Esri, an international supplier of geographic information system (GIS) services and products, including ArcGIS Dashboards, to build new, or enhance existing publicly available COVID-19 data dashboards. (Editor’s note: Mention of Esri and its products and services does not constitute an endorsement by CDC.) The effort focuses on the need to provide easily accessible and transparent information to guide mitigation measures.
Several states don’t yet have a dashboard. Through this new contract, they can request tools and services to build one. In states where a dashboard already exists, requests for enhancements can be made, such as automating data workflows, exposing services or APIs to improve sharing and collaboration, and applying best practices to data flows and visualizations. Each CDC/Esri engagement with a state is expected to last one to three weeks. As of this writing, three projects with states are complete and ten are underway.
CDC has recently awarded $10.25 billion dollars to US states and territories, and this support has a heavy focus on testing as well as data modernization and transparency.
The work on the dashboards is part of a larger data modernization and transparency initiative at CDC. The dashboarding project provides one way to improve consistent and reliable information to monitor the occurrence of COVID-19 cases across the country, giving states and the CDC insight they need to take action.
“We want to be ready and the data will help us,” Lubar said.
The enhanced reporting effort will also help states and CDC learn more about this pandemic to continually improve surveillance systems and the approach to protect public health, she added.
“We’ll continue to learn from the arc of this outbreak for years to come,” Lubar said.
See the COVID-19 GIS Hub for location intelligence resources. The Coronavirus Response solutions page provides a collection of maps and apps that can be used by agencies to understand the virus’s impact and share information about the pandemic with the public.

June 2, 2020 |

May 7, 2020 |
May 6, 2020 |