
June 9, 2020 |
May 27, 2021
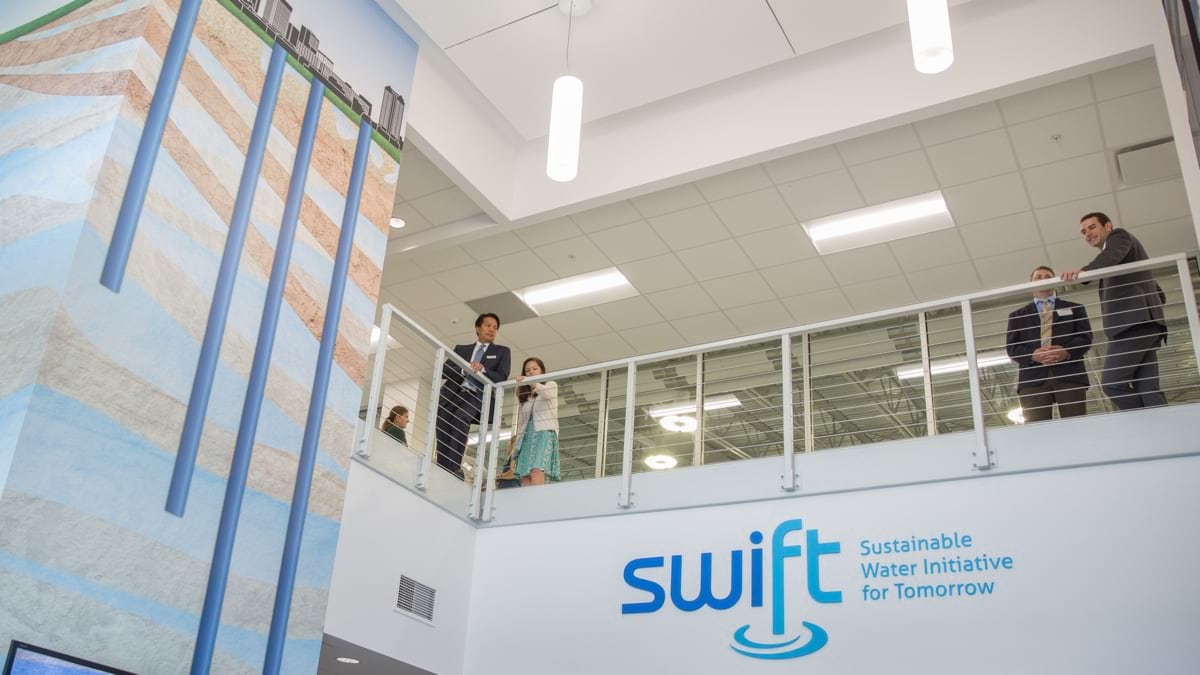
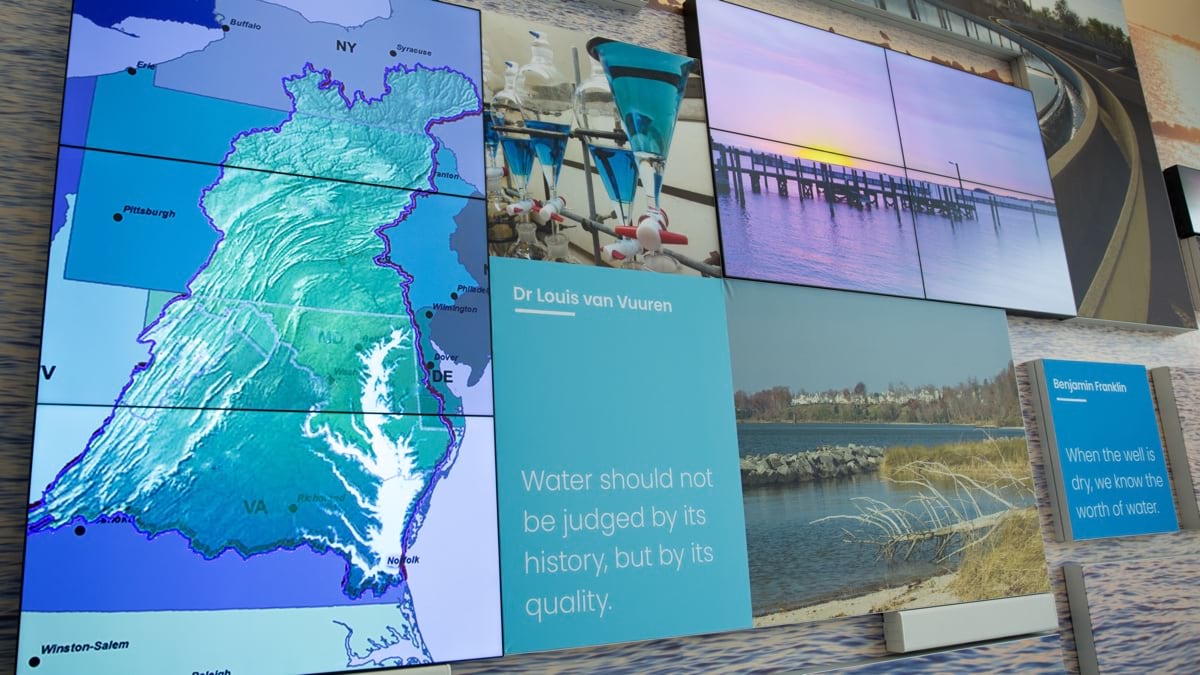
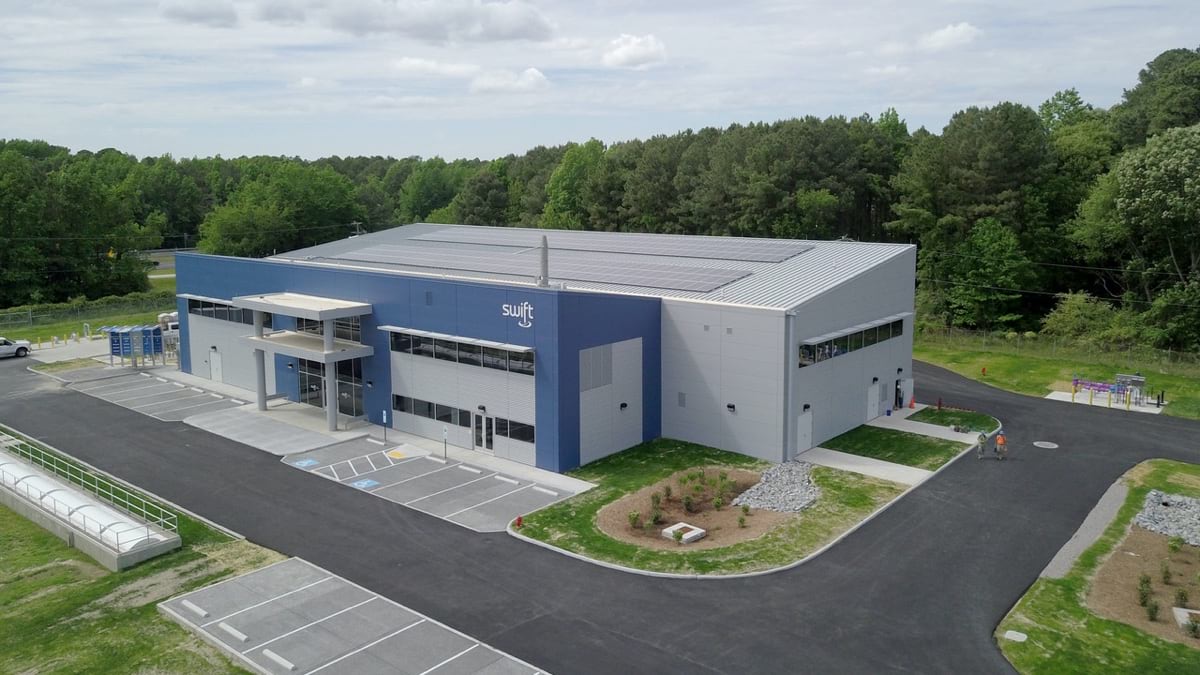
In southeastern Virginia, Hampton Roads Sanitation District (HRSD) handles wastewater treatment for 1.7 million people in 20 cities and counties. Sea-level rise, unusually high tides, and extreme storms prompted a $1.2 billion program—the Sustainable Water Initiative for Tomorrow (SWIFT) that involves replenishing the Potomac aquifer with up to 100 million gallons of SWIFT Water™ (water treated to meet drinking water standards and matched to the existing groundwater chemistry in the aquifer) per day, an action that may slow or reduce the impact of sea level rise by slowing land settling, or subsidence.
“Geologically, sea level rise in our area is not just about water warming and ice caps melting,” said Anas Malkawi, chief of asset management, HRSD. The HRSD service area includes a population of 1.7 million people across 20 cities and counties “Those are factors, but it’s also due to the overdraw of groundwater that causes the land to sink.”
The SWIFT solution will recharge the overdrawn Potomac aquifer with water treated to meet drinking water standards and matching existing groundwater chemistry. The work will renew a resource that has been greatly depleted over the past 100 years, arresting subsidence, adding resiliency to handle stormwater events, and combatting the growing issue of saltwater contamination.
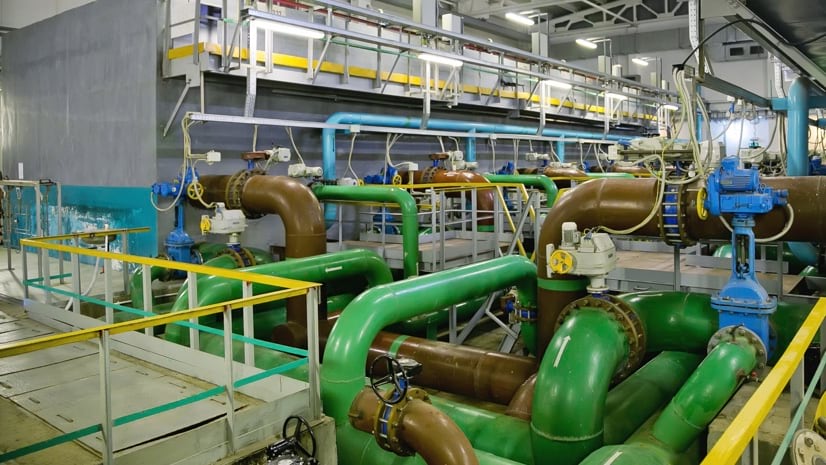
SWIFT and other innovative approaches are indicative of HRSD’s leadership. Well established in the area, HRSD has provided regional wastewater processing capacity since 1940. It operates 17 wastewater treatment plants collecting from pipes and pump stations run by local governments near the mouth of the Chesapeake Bay—and their work scope is growing due to environmental and economic pressures.
“Smaller communities can’t afford to meet increasingly stringent water quality requirements, because they don’t have the population, and can’t raise their rates high enough,” Malkawi said. “HRSD has a good bond rating to borrow funds, distribute the load, and upgrade the infrastructure across the whole region.”
As a cutting-edge climate action project, SWIFT provided the impetus for HRSD to employ new technologies, working with engineering firm Hazen and Sawyer.
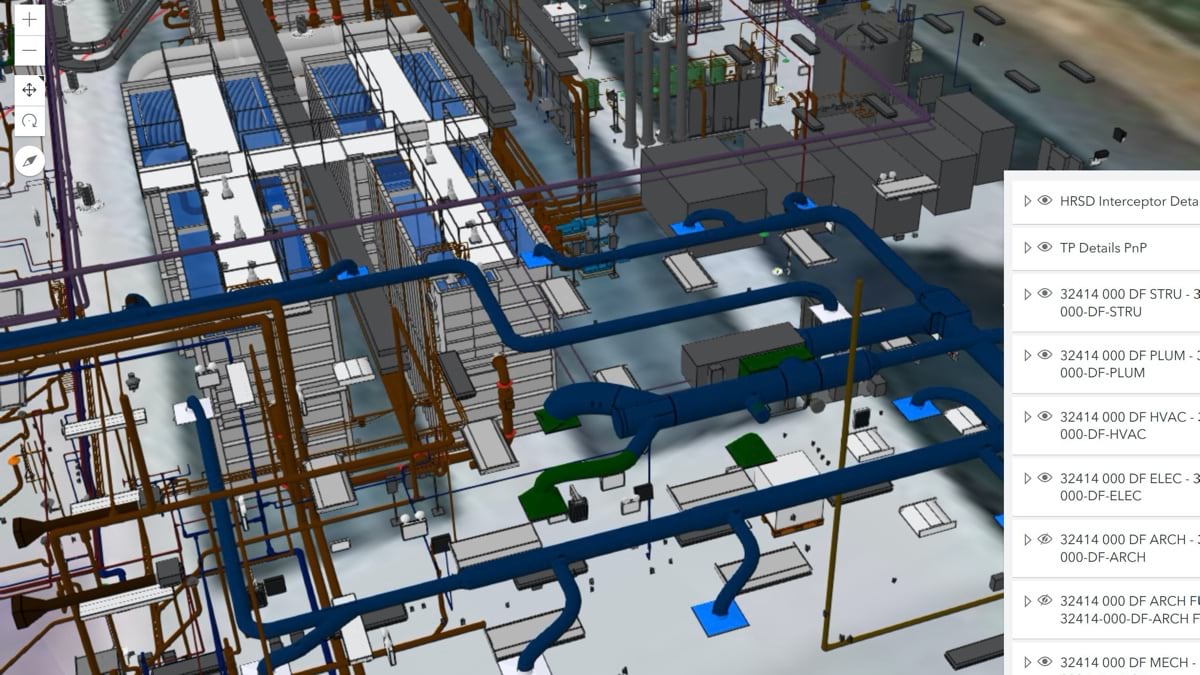
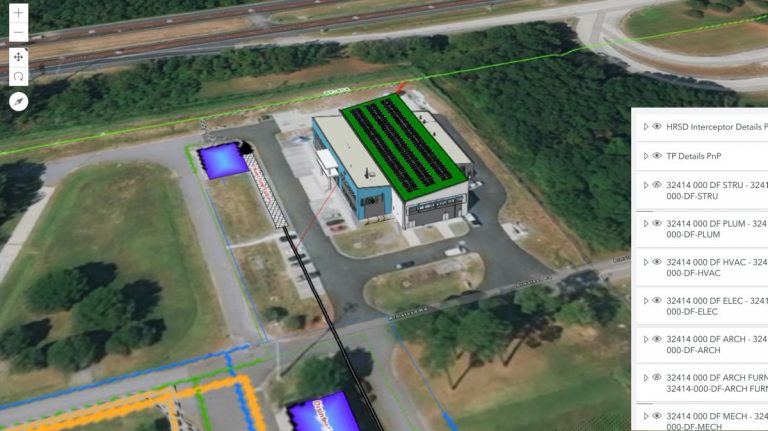
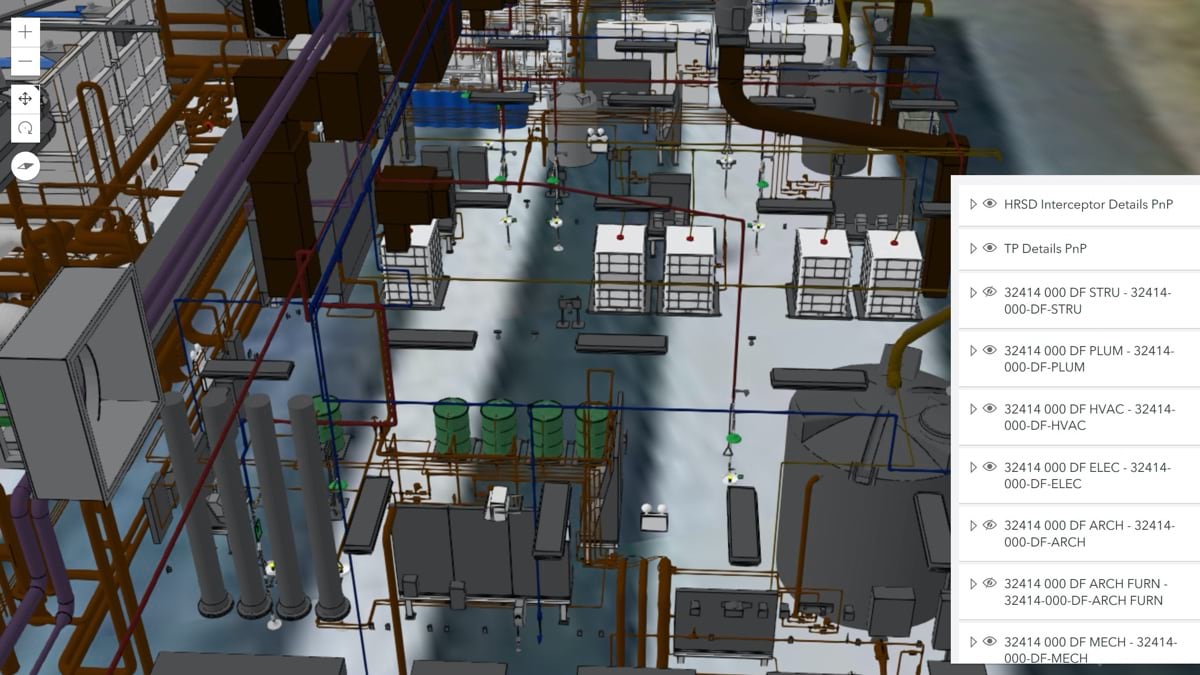
First, they combined building information modeling (BIM) designs with geographic information system (GIS) maps, workflows, and analysis. Together BIM and GIS data helped the district establish a feature-rich model, known as a digital twin, of the SWIFT Research Center that provides the proof of concept for the program. Over the next 10 years, HRSD will build at least four more facilities to resupply the aquifer with up to 100 million gallons of water per day.
Now, planners can explore the design models via virtual and augmented reality wearing goggles that immerse them in the infrastructure. Operational staff and construction crews can see where a new pump or asset will be located, for instance, and ensure it gets placed in the correct location. Facility owners can assess the maintainability and operations of assets prior to construction. And the models provide an ideal training platform for new staff.
“Seeing the full context of the plant in the design phase really helped us see the value it can bring to operations and asset management,” Malkawi said. “The ability to navigate through the plant with access to operational and maintenance data in one platform provides great value for our workforce.”
The digital twin is affording a higher level of operational intelligence with 3D data for newly constructed facilities and plans to capture the same for older facilities. While they are currently gathering and visualizing real-time sensor data, the team will eventually move to automating systems based on sensor input.
“We’ve achieved the standard value from our digital twin of more situational awareness,” Malkawi said. “We would like to simulate our system, looking at the behavior of the infrastructure and knowing, if I open a valve and change a process, what are the effects to the downstream process?”
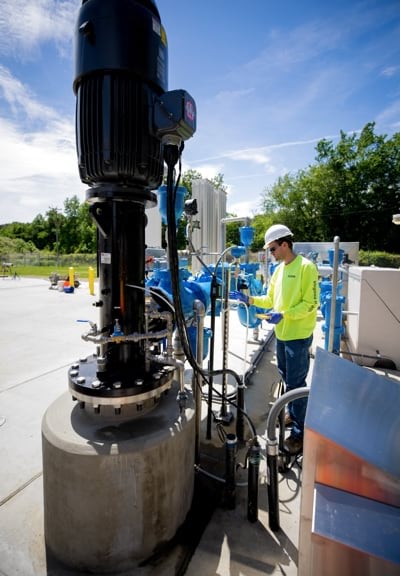
To help ensure water quality, HRSD crews test private and commercial irrigation wells near where treated water recharges the aquifer. They use sensors to measure shifts in water quality, syncing sensor data on a GIS map where it can easily be monitored.
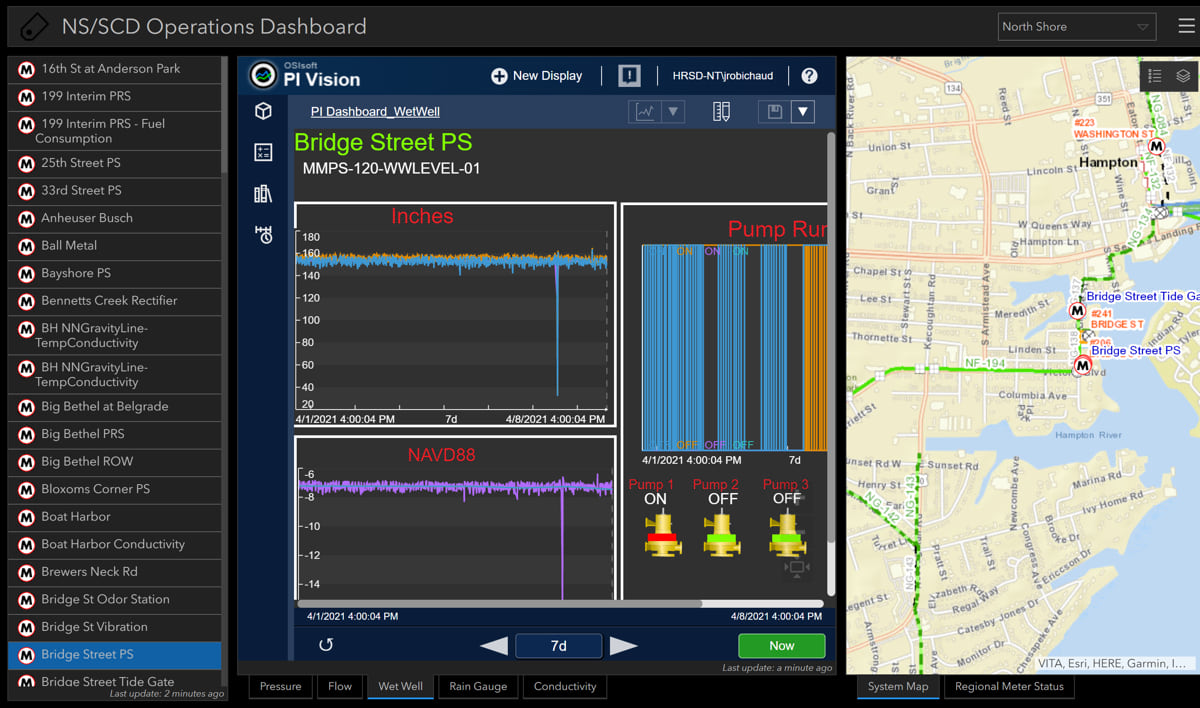
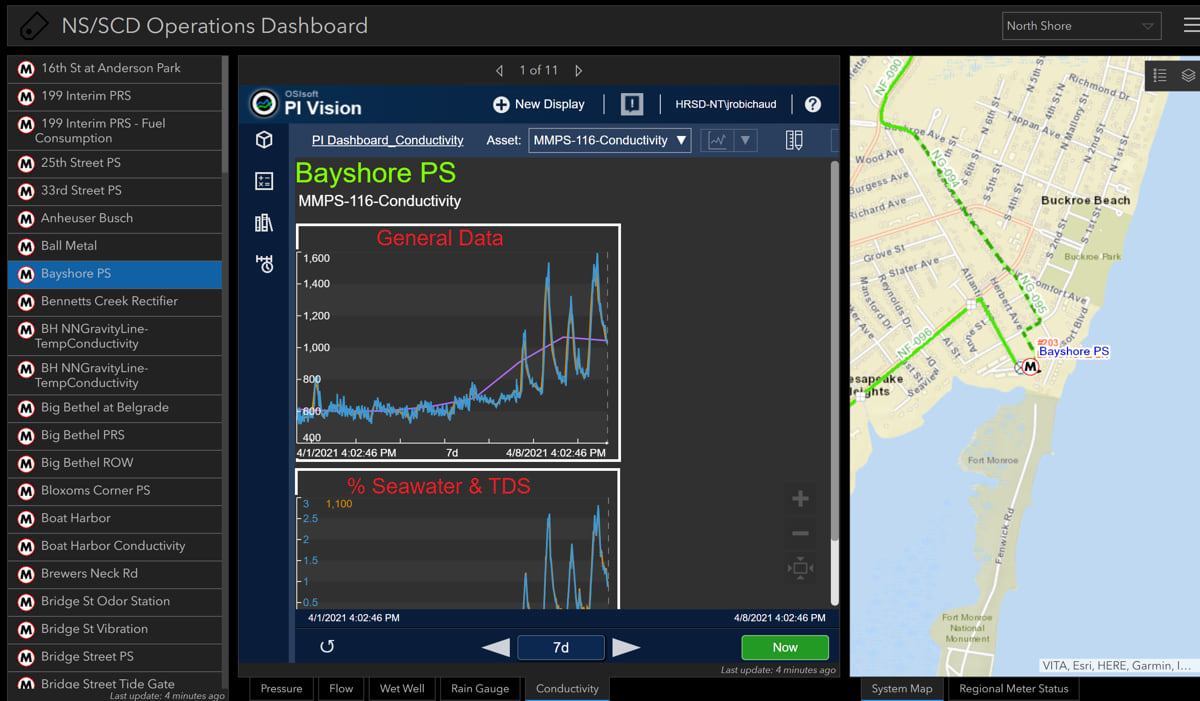
The district takes a similar, sensor-driven approach to monitoring pressure and pump performance for its 651 miles of pipes and 131 pump stations. Staff keep an eye on their GIS interface to examine assets at every location. The data feeds an operational PI dashboard with a map, sensor readings, and graphs to track variables such as salinity.
“We have conductivity meters on the different sections of our gravity system,” said Jules Robichaud, GIS manager, HRSD. “The historical data is one click away. In areas at high risk for sea level rise, we’re trying to get a sense of where high salinity may be an issue.”
When storms hit, the HRSD team works to reduce wastewater overflows and monitor infrastructure. With increasing storm intensity, and the compounding factors of subsidence and sea level rise, there’s greater urgency to protect wastewater drainage systems from spills. For this effort, the district will again lean on its GIS and digital twin technology.
“We have to make over a billion-dollars of infrastructure investments,” Malkawi said. “We have a consent decree with the US Department of Justice and the EPA that we have to meet certain targets to reduce or eliminate sanitary sewer overflows to a certain rain event level. Incorporating risk into the digital twin is going to be a huge value.”
For more than 12 years, the district has relied on GIS as a critical tool for day-to-day operations. In addition to smart maps and dashboards, GIS provides analytics to help HRSD meet growing infrastructure management needs.
“Our operators have GIS at their fingertips to navigate to linear assets like pipes, find information, collect information, and report it all out via a map-based tool,” Malkawi said. “If we need to know where the asset is in proximity to businesses, residences, local water bodies, and traffic, we use GIS. If there’s a failure on some of our infrastructure, we use GIS to understand the impact on the public, on worker safety, and the environment.”
Many of these capabilities have been aided by the modernization of GIS to deliver and consume data as services.
“We’re bringing in millions of records of data from multiple jurisdictions,” Robichaud said. “We automate scrubbing that data, combining it into regional layers, and making it available back to regional partners.”
The district’s water quality team uses GIS to track pollutants and pathogens to their source—an endeavor made easier by the integrated data environment.
“Having access to regional data for the jurisdictions we serve, the stormwater and sewer layers, and even parcel data to locate businesses, industries, and communities has been huge,” Robichaud said. “We tie lab results back to where samples were collected, and then share that with the Virginia Department of Health and the Department of Environmental Quality.”
HRSD started its use of GIS for operations, interfacing with its computerized maintenance management system (CMMS) and for managing customer information. “We have over 70,000 assets in our organization that all require routine maintenance,” Malkawi said. “Whenever we do a repair, we record what was done, what caused the failure, and other details.” GIS is used to know the age, condition, and performance of the asset as well as understanding risk, hydraulic capacity, and processes.
“We’ve used 20 years of GIS data to make maintenance decisions,” Malkawi said. “Looking at our pipeline failures, for example, we can do a hotspot analysis using GIS tools to see the primary areas of failure, what’s causing failures, and figure out what we need to do with the rest of the pipes that have similar characteristics.”
Learn how operators and engineering firms are accelerating project delivery with location awareness.


June 9, 2020 |

October 16, 2019 |

February 3, 2021 |