
February 5, 2019 |
March 21, 2019

This story is part one of a two-part series that examines the impacts of Philadelphia’s renewal policies. The next installment explores the impact of tax abatements and the growing interest in economic opportunity zones.
The City of Philadelphia declared itself blighted in the year 2000, after decades of population decline and increasing property abandonment. At that time, many city neighborhoods had been designated redevelopment areas, but little redevelopment was taking place.
The city shares a similar path to other northern industrial cities that have seen dramatic population declines since the 1950s. Deindustrialization and globalization triggered widespread relocation and those who stayed faced economic hardship.
“The good news is we didn’t suffer like Detroit where when the auto industry tanked it almost killed the city,” said Herb Wetzel, director of Housing and Community Development, Philadelphia City Council. “If we didn’t have the meds and the eds, that might have been our fate.”
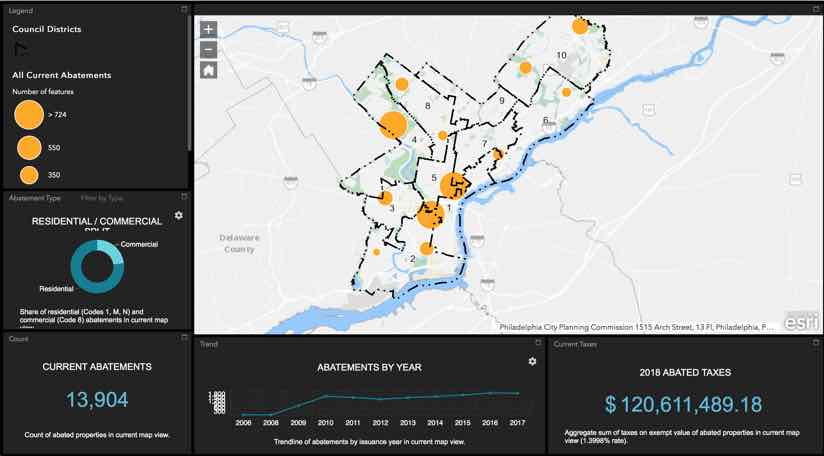
The city made a bold move to revitalize itself by passing a tax incentive that exempted commercial and residential property owners from having to pay property taxes for 10 years if they completed major renovations or new construction.
By the year 2007, this and other policy decisions began reversing the city’s steady population decline.
“We were a city that lost population for decades and now we have an opportunity to consider the redevelopment paths to take,” Wetzel said. “We’re in a unique position to manage growth rather than decline.”

Visualizing Impacts
In 2012, then-Mayor Nutter asked the City Council to authorize the Actual Value Initiative (AVI), the first citywide property tax reassessment in 20 years. This measure was the first step to realize higher property tax returns from a visibly transforming city.
“We knew that properties had been significantly underassessed for years,” said Darrell L. Clarke, president of the Philadelphia City Council. “Before we implemented a new tax assessment, we needed an idea of the impacts AVI would have neighborhood by neighborhood.”
Because parts of the city had gentrified, some properties were facing a 300 to 500% increases in property tax.
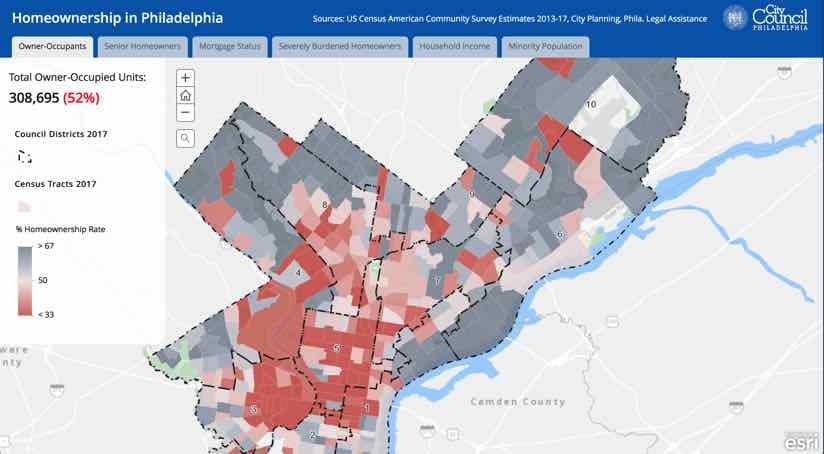
“We used GIS to map where property taxes doubled, tripled and quadrupled,” Wetzel said. “We also looked at the median household incomes in those areas.”
The City Council concluded the city couldn’t implement AVI fairly and efficiently in 2012. It authorized a number of relief measures to ease the transition for homeowners and prepared to implement AVI in 2013.
“Our work was informed by GIS, and it was not long after this that we added a full-time GIS analyst to City Council staff,” Clarke said.

Avoiding Displacement
The City Council enacted different measures to buffer the impact of the updated tax assessment for its vulnerable populations.
In sifting through the data, the city was surprised to learn that 40 percent of Philadelphia homeowners don’t have a mortgage. Many of them purchased their row homes in the 1970s when the prices were $8,000 to $10,000, and they have since paid them off. These same people are now elderly and on fixed incomes and don’t have the resources to pay the taxes on what their homes are now worth.
A senior freeze was placed on property taxes for elderly residents that meet an income test. This program allows qualifying seniors to defer property tax completely until their home is sold.
“Not only are the taxes deferred, but there’s no interest or penalty on it if you’re in one of these programs,” Wetzel said.
A long-term owner/occupant program freezes taxes at the current level for those whose property tax more than tripled. Taxes won’t go up as long as the person lives in the house. Again, some income tests apply in order to qualify.
GIS has become an important tool for these programs, analyzing the city’s population against criteria to find those that qualify.
“It’s all about zeroing into areas where we can do the most effective outreach,” said Greg Kingery, GIS analyst with the Philadelphia City Council. “It’s really helped us target our efforts to inform constituents who often don’t know these measures are out there for them.”

Understanding Constituents
To help the City Council better understand the people facing tax foreclosure on their properties, Kingery worked with a developer and managed the creation of a data connection to the Sheriff Department’s property auction site. The City Council now has a live link to this data to encourage those facing eviction to enroll in programs that will prevent them from losing their house.
In addition to the housing issue, GIS analysis helps councilmembers understand their constituents.
“Councilmembers use GIS to help inform policy discussions and formulate legislation,” Kingery said. “They have come to rely on a map-based report of key statistics of their constituents [such as population, racial makeup, mean age, median income] to gain a spatial intelligence about their district.”
The effort of the City Council’s GIS analysis builds on a strong central GIS team in the Mayor’s Office of Innovation and Technology. This team helps Kingery gather the data necessary for the analysis as well as helping develop applications to support the City Council’s work.
“We have crafted and authorized a number of forward-thinking policies to support our goals of equitable development throughout the City of Philadelphia,” Clarke said. “The addition of a GIS analyst has proven invaluable to this work.”
Learn more about how GIS supports planning and development. Affordable Housing is one of many topics addressed on the Esri Maps for Public Policy site. Visit this resource to see how maps and spatial data help leaders make data-driven decisions.


February 5, 2019 |

October 31, 2017 |

February 1, 2019 |