I often find myself explaining aspects of map scales to people trying to use maps. They are interested in questions about how big something shown on the map is, or how far a distance measured on the map is, or the accuracy of features depicted on the map. As the creators of the maps we must understand the nuances of maps, so that the people who use them can use them appropriately. After all, with great power comes great responsibility!
One of the areas that I find confuses people is map scales, resolution, and minimum mapping units (MMU).
Map Scales
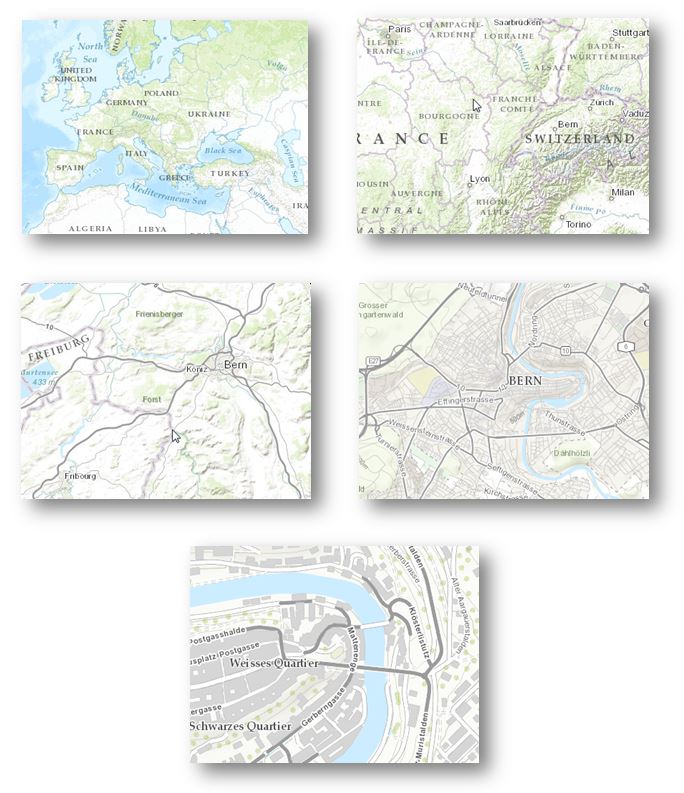
Traditionally a map would be produced at a fixed scale. For example 1 inch on the map equals 4 miles on the ground, which could also be represented as 1:250,000 (or 1 inch = 250,000 inches which equates to about 4 miles). In modern times, the mapmakers would produce the map from data that was at least as accurate as the final map scale. (In olden times, there were a lot more places with no data, so they left those places blank or made educated/or not so educated guesses.) This scale restricted the level of detail you would show on the map; for example on maps where the scale is 1 inch = 4 miles, if you wanted to show a feature that was 100 feet across in real life, it was smaller than the width of your pen, so you dropped it off the map. This physical limit of the technology of ink and pens allowed the cartographer to use their local knowledge to simplify some features and highlight others and make them generally readable and generally in the right place.
Over time as finer and finer details of the location of things were collected, cartographers often would make VERY detailed maps at much more detailed scales such as 1:1,000 or betterand then bring together a collection of those maps to derive a less detailed map (for example 1:250,000). Doing this work required the map makers to generalize the data and leave some information out because it was not appropriate at the new scale. Over time this artistic process has increasingly been automated using display rules on the data (see http://www.esri.com/esri-news/arcnews/winter1314articles/transforming-national-map-production).
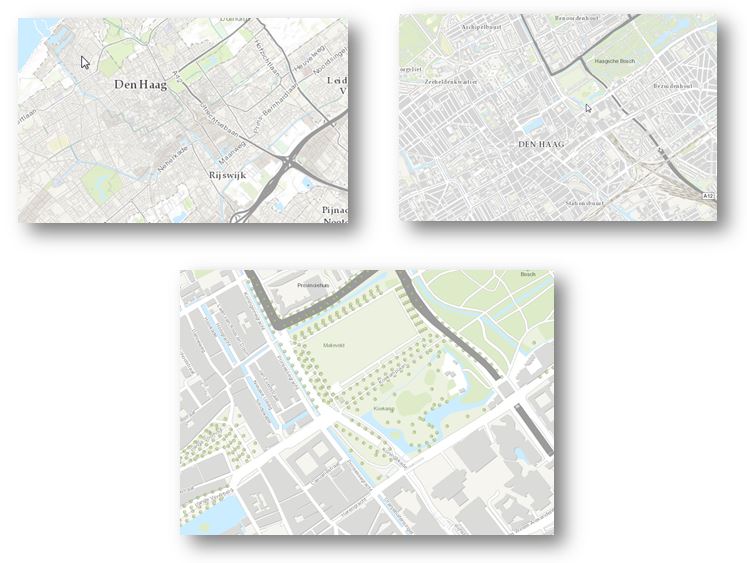
All maps have a scale, but in today’s digital world of pan and zoom, scale is less obvious. How can it be determined? In the interactive digital mapping world, when you work with a map you are actually working with a stack of maps created at different scales to show you the data you should see at the scale you are currently zoomed into. These are sometimes called multi-scale maps.
Resolution
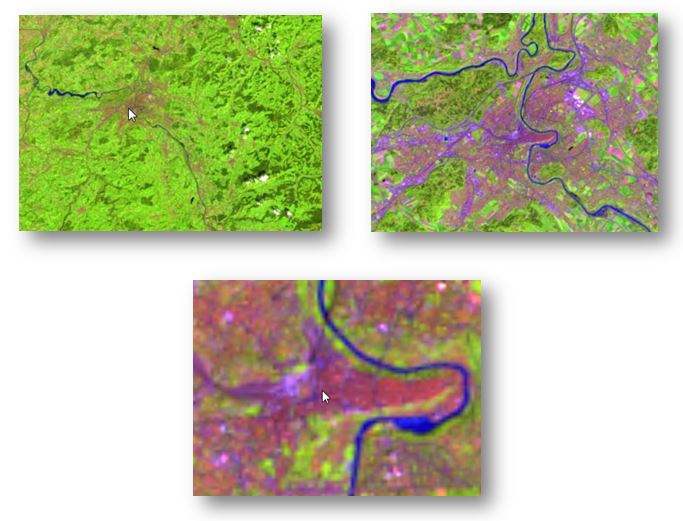
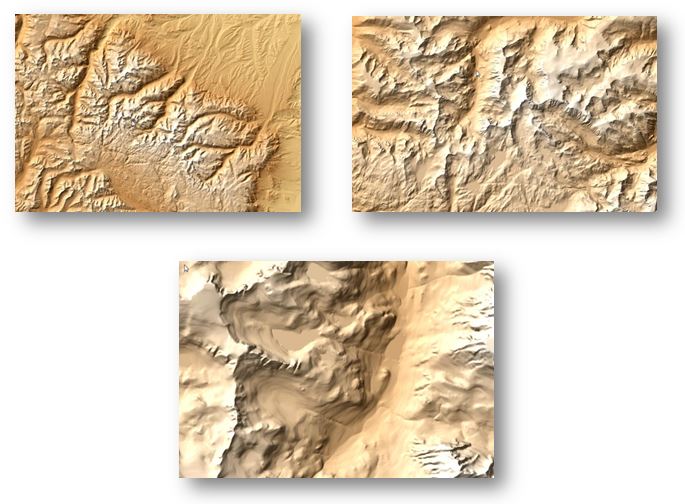
With maps, resolution generally means one of two things. Either the spatial accuracy of the data (used interchangeably with ‘scale’— “What’s the resolution of that country data?”), or more commonly, the specific data precision of raster data. Raster data is unique in spatial data as it has a visible measure of how precise the data is: When a raster is created, it is a fixed set of rows and columns, and each cell in this set is a fixed size. That fixed size is the resolution of the data. With raster data, that cell is often referred to as a pixel. Each pixel/cell has some sensed valued associated with it, which could be values for RGB to determine a color, or values from other wavelengths such as infrared, or derived values (such as slope or elevation.). The map uses symbology applied to these values to draw the raster. The most common raster data is imagery (from satellites, airplanes, or increasingly drones) or derived raster data from analysis (such as a digital elevation model or DEM). An example of imagery is that from Landsat—its raster data can have a 15m resolution (each cell in the rows and columns is 15m x 15m in size). Resolution is based on the sensor or the technique used to create the raster. It is important to recognize that rasters can be processed and their cell size changed, this does not change the resolution. For example Landsat imagery has a 15m resolution, you could process the data and change the cell size to 5 m, but the resolution of the data is still 15m.
MMU
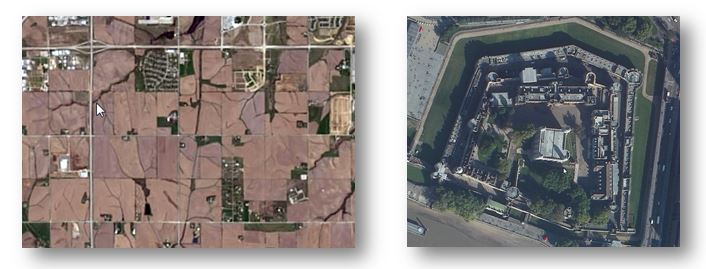
The MMU (minimum mapping unit) is the specific size of the smallest feature that is being reliably mapped in your map. MMU is used in both data collection and in map production. In data collection the MMU helps you know when to collect specific data. For example, if you are collecting building footprints and the MMU is 100 sq. m, you don’t need to collect the footprint of small outbuildings. When making maps, MMU is especially useful as it puts the scale and resolution in context of real features. As the cartographer brings together sources from many maps, the MMU provides the framework to judge if the features should be shown at the selected map scale. So while a small lake is in the data, it may be best to show that lake only when zoomed in at a specific scale and not shown when zoomed out. Understanding the MMU allows you to standardize what features should be shown at various map scales.
Understanding is Important
Understanding scale, resolution, and MMU is very useful when making maps. But the mapmaker must remember that some map users do not understand these concepts. Therefore, we, as the map makers, must be diligent in assembling the maps. This includes documenting the source scale of your data, using dynamic symbology and visibility based on scale, and building multi-scale maps. Software continues to make it easier and easier to make good maps, and making great maps is more than just understanding scale, resolution and MMU, but understanding these will always help make better maps.
insider
