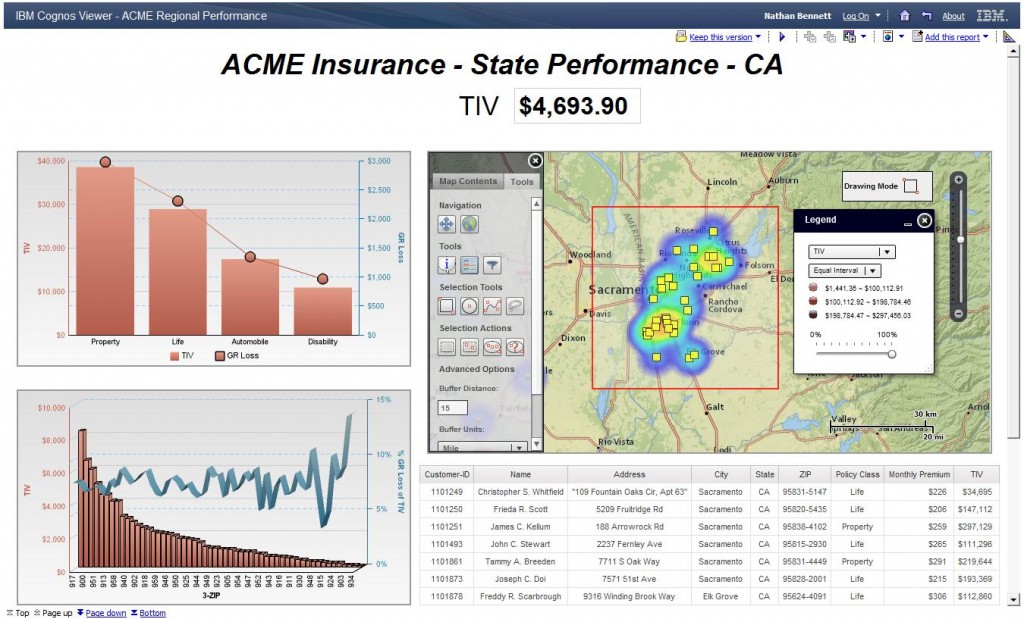
The outbreak of bad weather that has plagued the US over the past few weeks has created a significant need for access to location data and pre- and post-event map imagery. I was recently on a call with a former colleague who was looking for the latest post-event imagery. He described how imagery and other recently available features of ArcGIS Online, Esri’s cloud-based mapping platform, were having a significant impact on streamlining their claims workflow and efforts to effectively align field resources.
He went on further to describe how the ArcGIS Online-based mapping solution they created is reducing the time required to perform lots of other tasks that had been mostly manual and labor intensive before.

With ArcGIS Online, the need to wait for claims adjuster validation was drastically reduced. Now within a matter of hours after event data is released, their organization establishes a more precise count of the customers who were in the impacted area. This has helped them to improve the speed at which they respond to their requests for information made by internal and external stakeholders. They have also reduced the impact it had on employee resources required to generate the report.
The stakeholder requests for customer impact data following events like these are customary. We’ve discussed one simple example of how one insurance organization has benefited from ArcGIS Online. We believe there might be several. Thinking about what maps can mean for improving workflows and customer engagement processes in your organization, what are other tasks that the use of ArcGIS Online and maps will improve?
insider
