Many of us are familiar with the term “cause-related marketing.” Sometimes the phrase is applied in a broad sense to any effort to increase public awareness of an important issue. A narrower definition is a campaign by a corporation to support a cause, either (cynically) to promote its own brand or (unselfishly) to lend its support to a worthy pursuit—depending on your point of view.
The Internet, the airwaves, and print media are rife with cause-related marketing. How many times, for instance, have you encountered ads by oil companies and automobile manufacturers touting their “green” practices? Cause-related mapping, on the other hand, is a far less common phenomenon.
What is cause-related mapping? It’s my own term, so I’m happy to propose a definition: It’s the use of maps, in combination with other rich media, to inform and engage the public in support of important causes.
There is vast, untapped potential in cause-related mapping. Consider three facts:
- Every issue you can think of, from climate change to poverty reduction to job creation, has interesting and important geographic characteristics.
- Maps reveal spatial patterns, facilitate understanding, and help us make sense of the world.
- Most people like maps.
And yet how many times can you recall an organization using maps to show you why an issue is important and what you can do about it? Hardly ever, right?
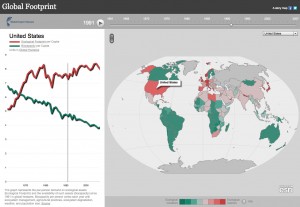
Our story maps team is beginning to explore this largely uncharted territory of cause-related mapping. One of our early projects highlighted the Global Footprint Network’s insightful examination of the rates at which most nations are overspending their ecological capital:
Recently we teamed up with the National Audubon Society to depict the life cycle of the Piping Plover, a shorebird that nests, precariously, adjacent to Atlantic Coast beaches and is thus in constant conflict with Homo sapiens recreationi. The story reveals the many threats facing these beautiful little birds as they breed, migrate, and winter, and it shows how Audubon is working to protect it at every step of the way.


Maps can help turn abstract issues into tangible, understandable, solvable stories. Maps can inspire action. Let’s use them not only to measure and observe the world, but to change it.