Dilapidated and vacant buildings in a city are a blight that not only distresses the urban landscape but causes health problems, decreases property values, and attracts criminal elements. Before managing urban blight, cities need to know where it is. Understanding a problem is half way to solving it. New Orleans is asking its community to participate in an urban blight data collection process by simply using an app that shows building photos and asks a few survey questions about the condition of the property.
New Orleans is using the app to collect data about the status of the city’s 150,000 properties. To get started, staff drove every street of the city capturing photos of each building with two consumer grade cameras with wide angle lenses, which they bought from the local tech store. They also had an integrated GPS that tagged the location to each photo taken. They then uploaded the pictures to a data layer and joined them to corresponding parcel location data.
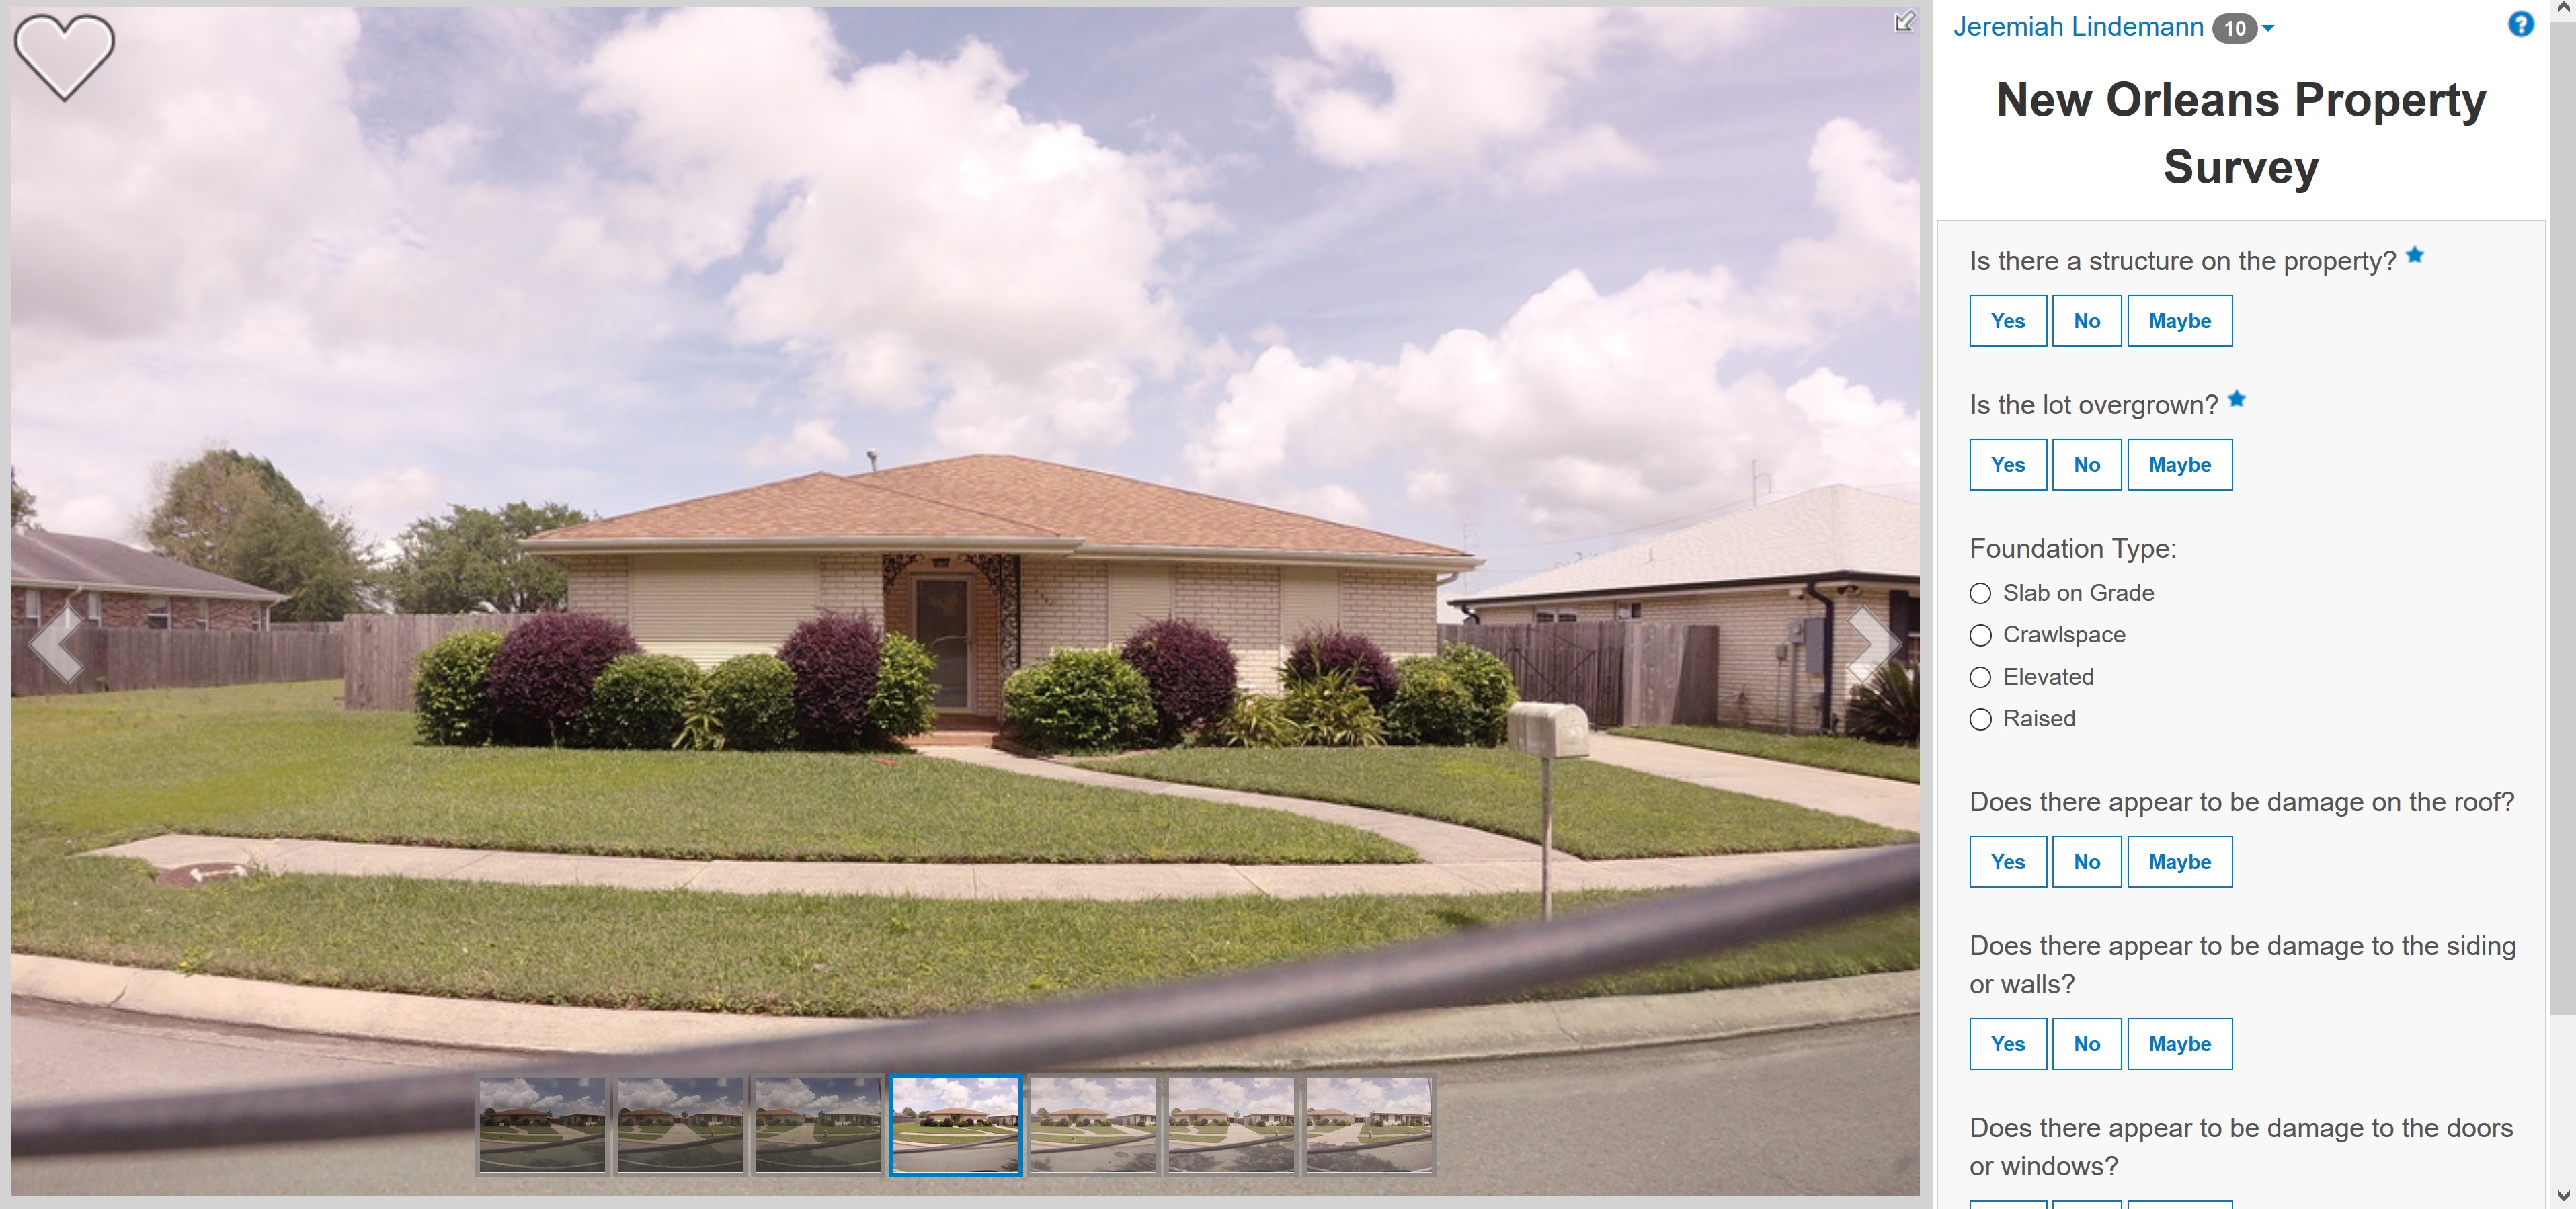
The city did not have the resources to actually complete the survey for these properties, so it asked Esri to build a crowd sourcing solution. Esri created the Photo Survey app, which any local government can use to publish street-level photo collections. Now citizens can become involved in the community project by accessing the app, answering the questions, and clicking send to add the information to the Photo Survey data layer on the server.
In just one month people had joined in the project and completed 16,000 surveys. The simple 10 second survey is easy. Answer these six questions: 1) Is there a structure on the property? 2) Is the lot overgrown? 3) Is there apparent damage to the siding or walls? 4) is there apparent damage to the windows or doors? 5) Is there damage to the roof? 6) What’s the foundation type?
Volunteers can complete the questionnaire anywhere and at any time. This is much faster than the traditional sidewalk survey in which a surveyor takes photos and subjectively grades a property as good, fair, or poor.
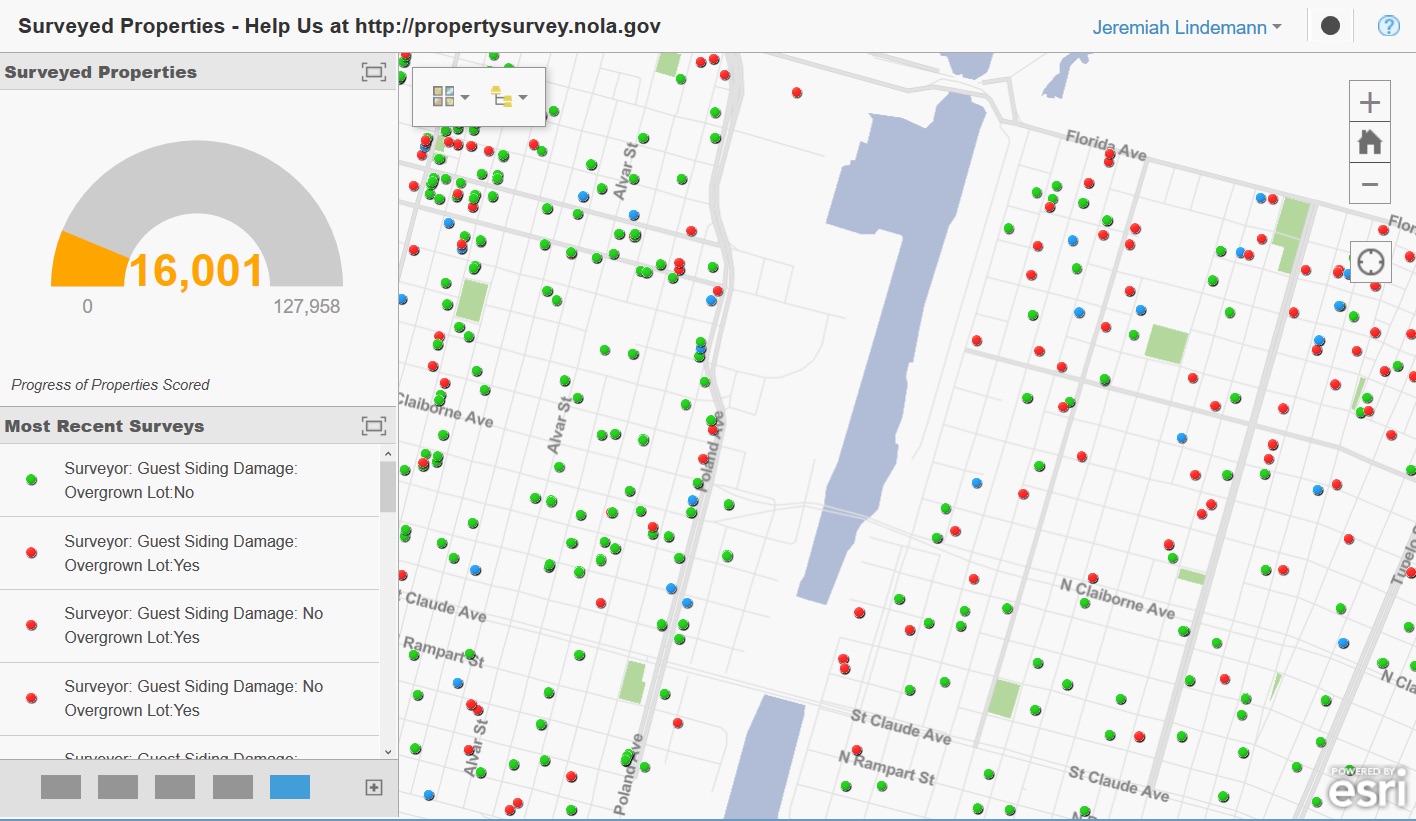
On the city side of the app, managers have a dashboard. A gauge shows the number of surveys completed. Bar charts show the number of problem types reported such as damaged roofs. A color-coded dot indicates parcels that have been surveyed. Click on the dot and see the property. By panning over the city, the user sees structures with code violations and even clusters of issues that may indicate a trend.
insider