Demographics, lifestyle, and spending data provide answers to the “Who, What, and How” questions that business owners need to ask.
When local Economic Development departments need to attract new businesses to fill empty sites, where do they start? The answer: Show ‘em some data!
Data about the types of people who live, work, and shop near a site is like gold to business owners, revealing incredibly valuable intelligence. To learn where a new site can be successful, business owners need answers to three basic questions about an area population:
- Who are they?
- What do they do?
- How do they spend their money?
Who are they? (Demographics)
Esri Demographics provides data about a population such as age, gender, income, housing, family type, education, and employment. This kind of information can provide business owners with important details about the people who live near a potential business site and help them answer questions such as, Are people in the area old, single, married with children, or married with no kids? Are they wealthy or struggling to get by? Are they new arrivals, or have they lived in the area for a long time?
This type of information not only enables Economic Development staff to better promote the site to prospective businesses, but also helps to show prospects a real and quantifiable description of the types of customers they need.
Analysts can provide maps based on the demographics of age, income, and household type to locate where most of these people live. The senior population could be a secondary target, and may be considered as another source of revenue. Additional revenue could also be generated by the daytime population that works near a site, but might live outside the area. The information about household income illustrated on a map is a good start; however, for more detail about the preferences and lifestyles of the population, lifestyle data can be added to demographics.
Economic Development staff could easily see which types of businesses might fit into the site, based on the median household income of the local population. Conversely, maps can also enable development companies to locate areas where customers with their targeted income ranges could be found.
What are they like? (Lifestyles)
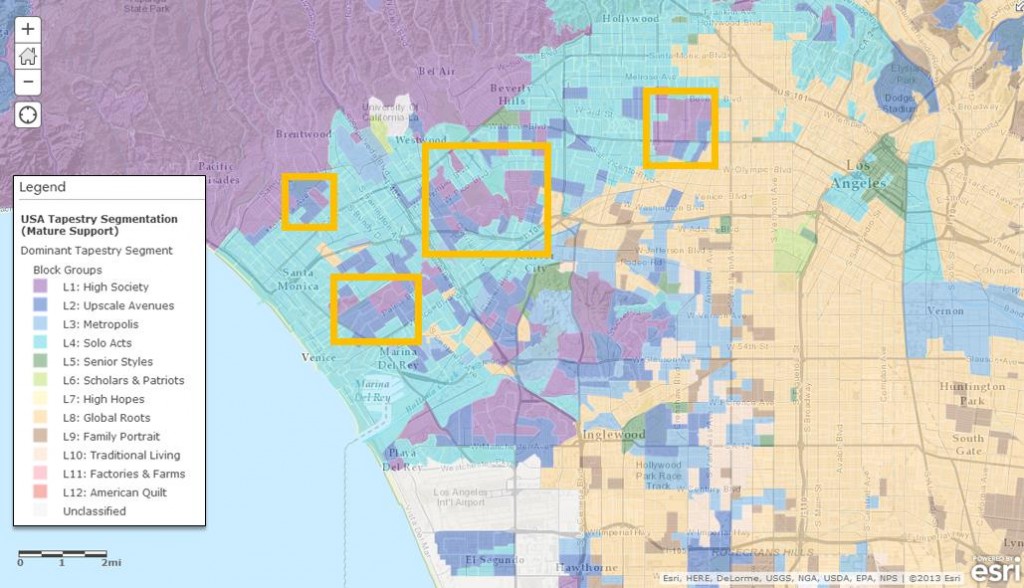
Lifestyle data adds a new perspective to demographics. Lifestyle data, often referred to as segmentation, is based on the principle that people with similar tastes and lifestyles will seek others with the same tastes; i.e., singles are less likely to gravitate to suburban neighborhoods of married couples with children.

Income ranges and lifestyle criteria can be used to identify as a possible areas for business expansion. Armed with lifestyle data, Economic Development staff could then show potential businesses not only the demographics of the targeted area, but also their lifestyle and media preferences. This information provides valuable insight into the likelihood that area consumers would patronize the business and the best ways to communicate with them.
How do they spend their money? (Spending data)
Spending data provides even more detail about how a local population spends its disposable income. Esri’s Consumer Spending data compares area spending by household for a variety of categories to the national averages. Market Potential data measures area demand versus national averages. Economic Development staff can study the indexes in each database to determine actual spending by adult or household, and the potential demand for different categories.
Location is a critical element for any site selection or trade area analysis. Studying the competitive landscape is necessary to ensure that a new site won’t cannibalize current spots. Business Locations data is a valuable asset to find businesses by industry sector and can reveal a wealth of information about these businesses. Drivetime—how far people would drive to patronize a prospective business—is also a valuable consideration.
Viewing the Tapestry Segmentation map and the other information, Economic Development staff can quickly and immediately see the types of companies that might be interested in a particular site. Staff can then compile a list of potential businesses that meet the criteria. Presentations of the analysis, illustrated with charts and maps, can be created to provide to potential candidates.

Data Generates Business Success
These three data types—demographics, lifestyle, and spending—can provide answers to the “Who, What, and How” questions that business owners can use to take a quick look at potential sites. Demographic data supplies information about “who” the local population is; lifestyle data answers the “what” question about activities and media preferences; and spending data shows “how” area consumers are actually spending by household. Armed with this insight, the locations of empty sites meeting the owners’ specified criteria could be further researched and visited.
Using demographics, lifestyle, and spending data in this way enables companies to hone in on only the sites that fit their criteria and avoid the “scattershot” approach by having to investigate an entire area. This is a clear example of how data can provide actionable answers to resolve a business situation.
