In the US, drug overdose is the leading cause of accidental death, with opioid addiction driving the epidemic. Opioids include both legal drugs, used for pain relief, and illegal drugs like heroin. These drugs are highly addictive, and anyone from any walk of life can become dependent on them. In 2014, more than 29,000 opioid related deaths occurred in the US.
Top priority actions communities can take to meet the opioid crisis are to locate vulnerable areas, improve prescribing practices, increase access to treatment services, monitor prescribers, increase public awareness, and inform the public about prescription drop off locations. Maps provide clues to help decision and policy makers target their epidemic intervention activities.
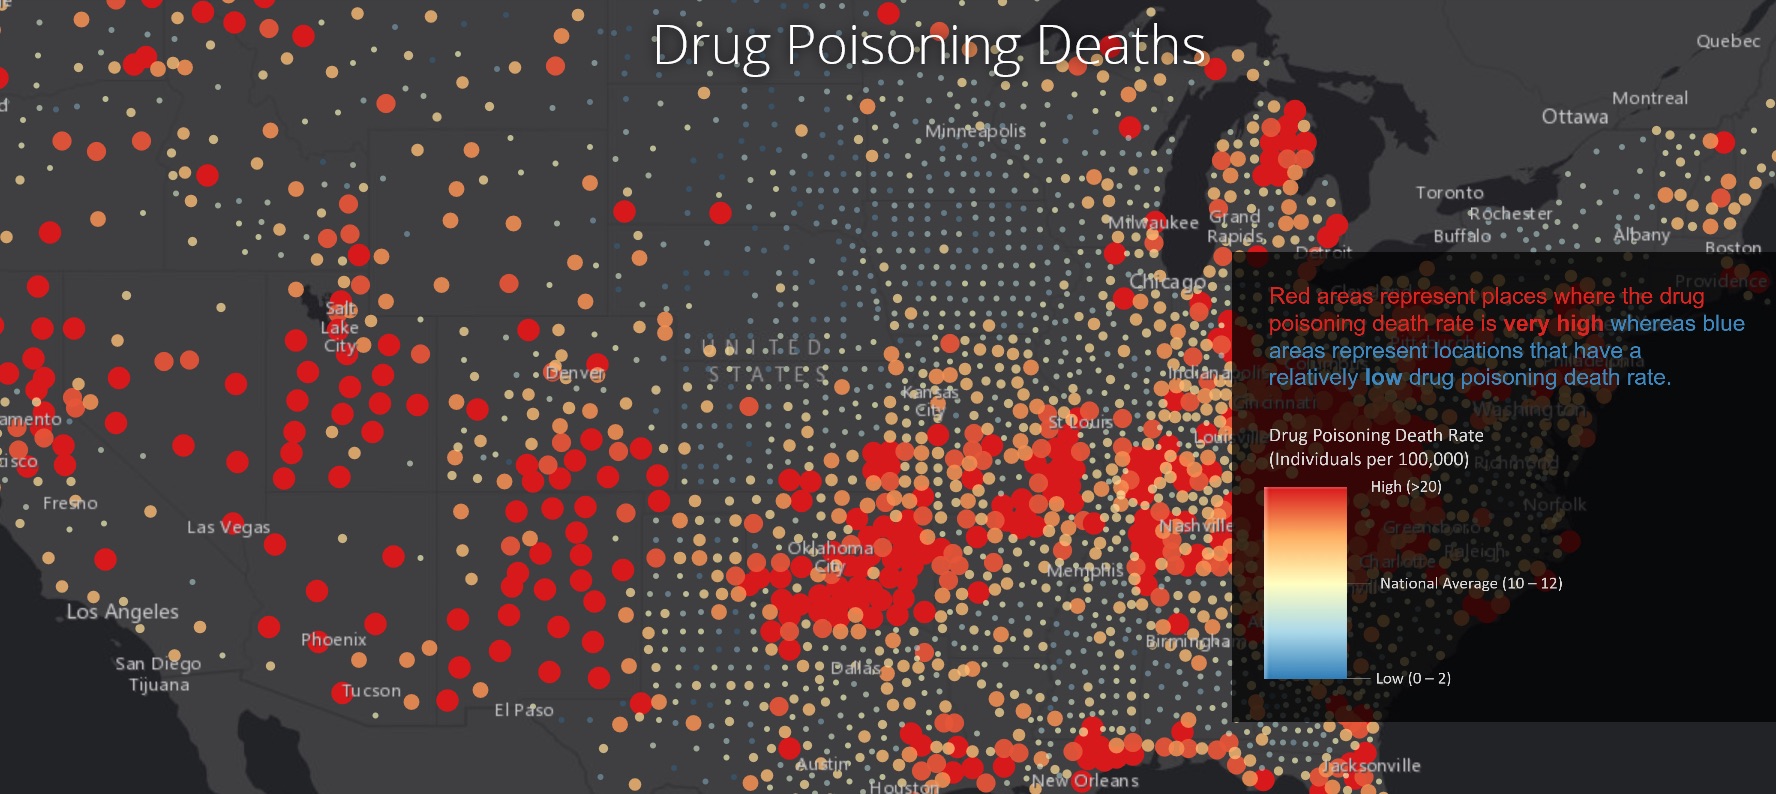
The Opioid Epidemic Storymap by Esri includes maps, images, and information to show communities where problems lurk and ways to take action. Maps show, by US county, the location and amount of patients’ prescription claims, prescriptions by provider, and opioid drug poisonings.
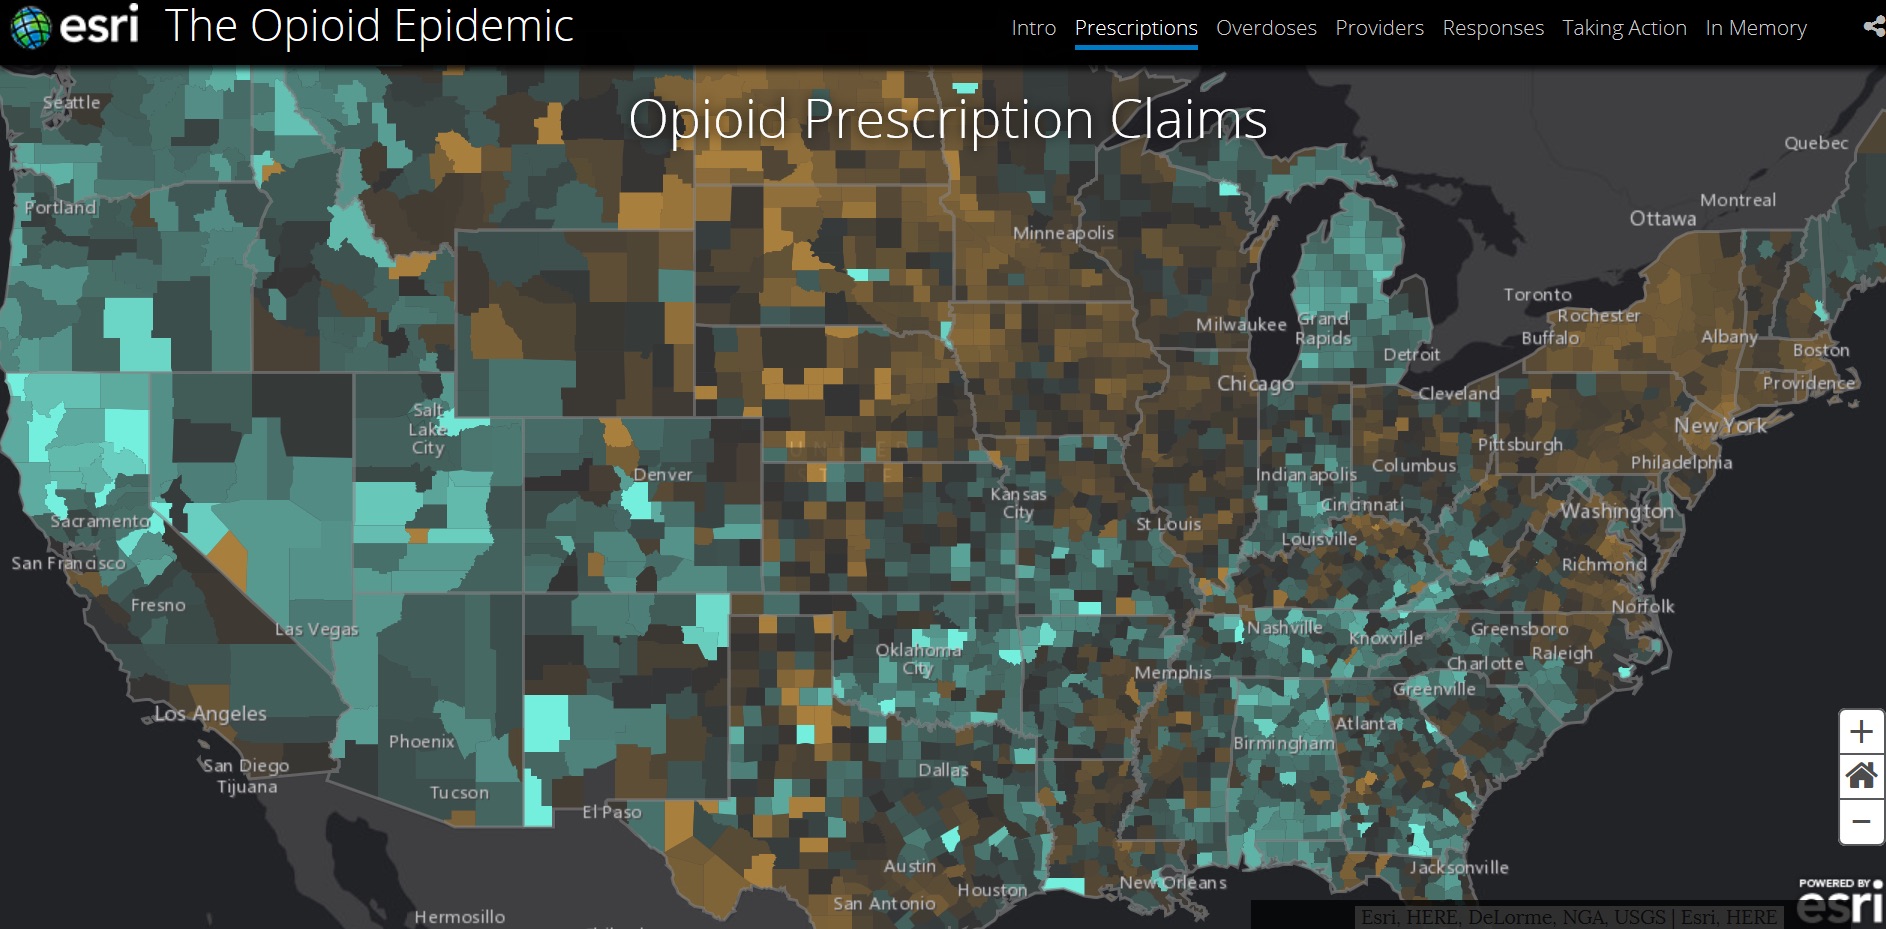
Geospatial analytics takes data to the next level by correlating proximities of high overdose incidents with areas having high inappropriate over prescribing. Spatial analysis tools are a means to analyze data streaming from the web, see trends over space and time, and model complex point data to map at risk areas.
By mapping local opioid data, communities can see their own vulnerability to addiction. Geospatial intelligence gives health administrators a greater understanding of overdose issues at the local and neighborhood scales. They can better formulate very strategic, targeted, and tailored efforts that are both effective and save money. A community’s set of maps should include opioid mortality, prescription drop-off locations, and treatment areas.
An opioid mortality map is a tool for realizing and communicating drug-related problems as well as a baseline to show changes in deaths over time. To study cause and effect, a health analyst can combine the mortality layer with CMS prescription claims data, census demographic data, and so forth. This insight can go a long way in securing needed project funding and evaluating intervention efforts. Data for opioid mortality maps may be obtained from vital records departments within public health agencies.
Families and friends play a role in drug addiction by freely sharing their unused pain relievers. Once patients have completed treatment, they need to dispose of their medications immediately at safe locations. Geospatial site analysis tools help health departments select medication drop-off sites based on variables such as neighborhood demographics, site safety, and accessibility.
Geospatial analytics are also useful for determining the best locations to place treatment centers. Moreover, web apps help health service administrators monitor activities at these treatment centers by mapping clients served, case success rates, and staff resources. Cities can embed drop-off site and treatment center maps into their websites so that people can find them when they need them.
Geographic intelligence plays an integral role in helping cities meet the challenges of opioid addiction and overdose deaths. Integrating health data with geographic information gives health service managers an understanding of who, where, when, and why the epidemic is occurring and who it is impacting. It also lays the foundation for effective policy and decision making.
insider