Ongoing sesquicentennial observances have heightened interest in a topic that millions of Americans have always found spellbinding. The saga of the Civil War seemed an ideal opportunity to test some techniques for timelines, animations, and search functions tied to interactive maps.
The “Battlefields of the Civil War” map was the latest in an ongoing effort to show how intelligent maps can help users explore subjects over both space and time. We’re also seeking to give users different options for browsing, navigating, and discovering content—even within a single story map.
To build the story, we first created a web map. We compiled a spreadsheet of Civil War battles, using Wikipedia and the Civil War Trust as sources. We geo-tagged the battlefields by tapping POI Factory’s free database of GPS points. And, with the permission of the Civil War Trust, we added links to many of the dozens of beautiful battle maps that grace their 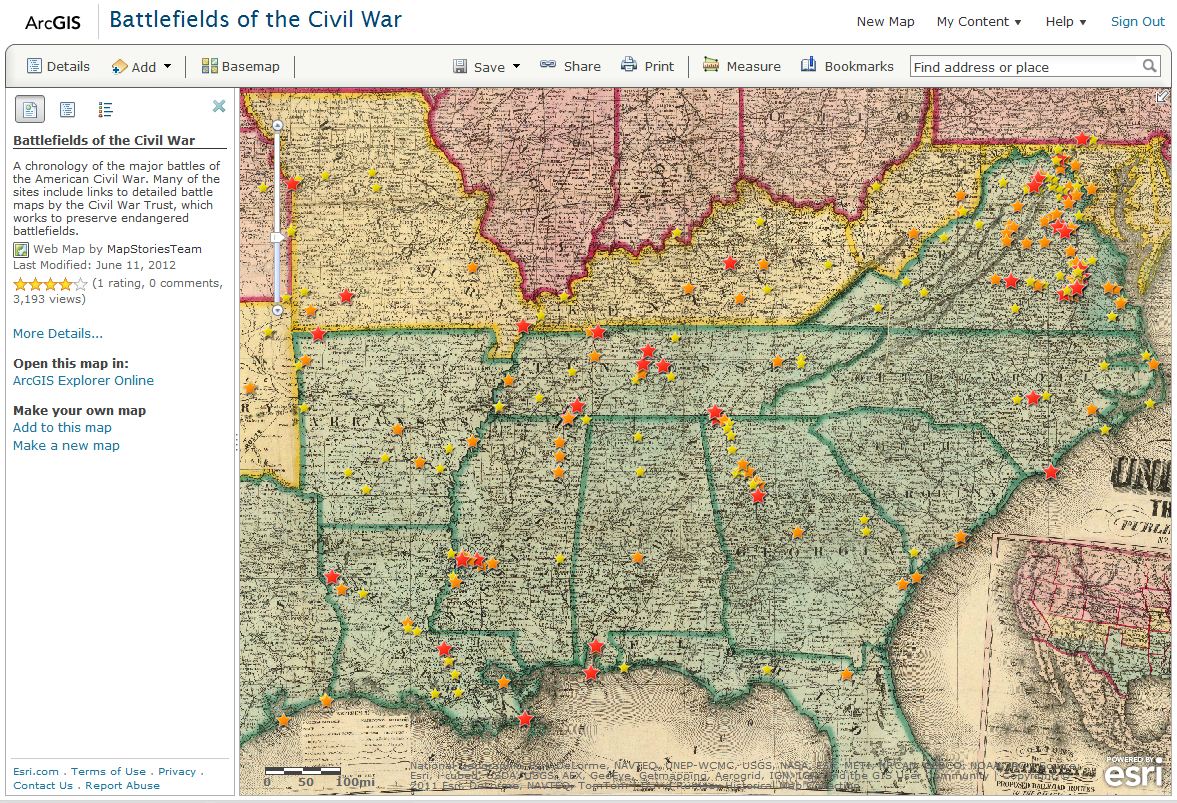 excellent website. Finally, we contacted map collector and technologist David Rumsey, who made a period map available to us. (You can see many more of David’s maps in the David Rumsey Map Collection public group on ArcGIS.com.)
We further refined the map by configuring its popups. Web map authors often neglect this key step. ArcGIS Online has an array of 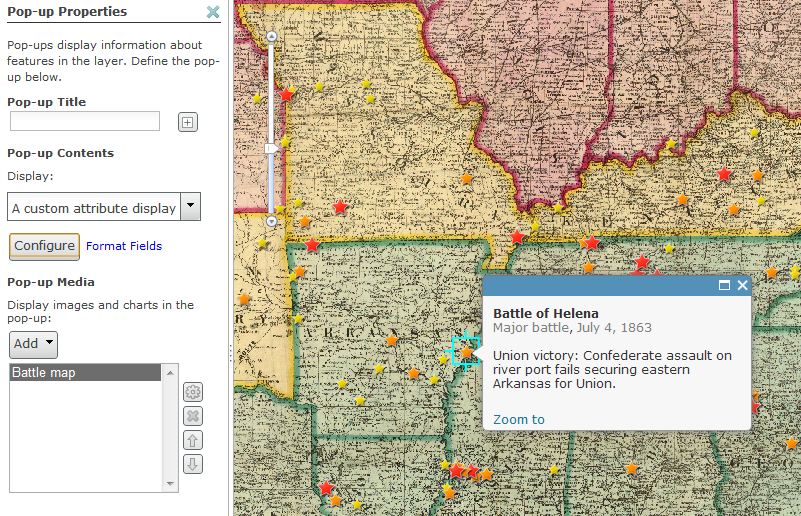 options for refining the contents of popups. I find the most versatile to be the “custom attribute display” option (left). This lets you pick and choose among the field names from your spreadsheet in any order you wish, and to apply basic text editing tools, including color, boldface, italics, etc. After a variety of these sorts of adjustments, the web map was a nicely presented collection of useful geo-information.
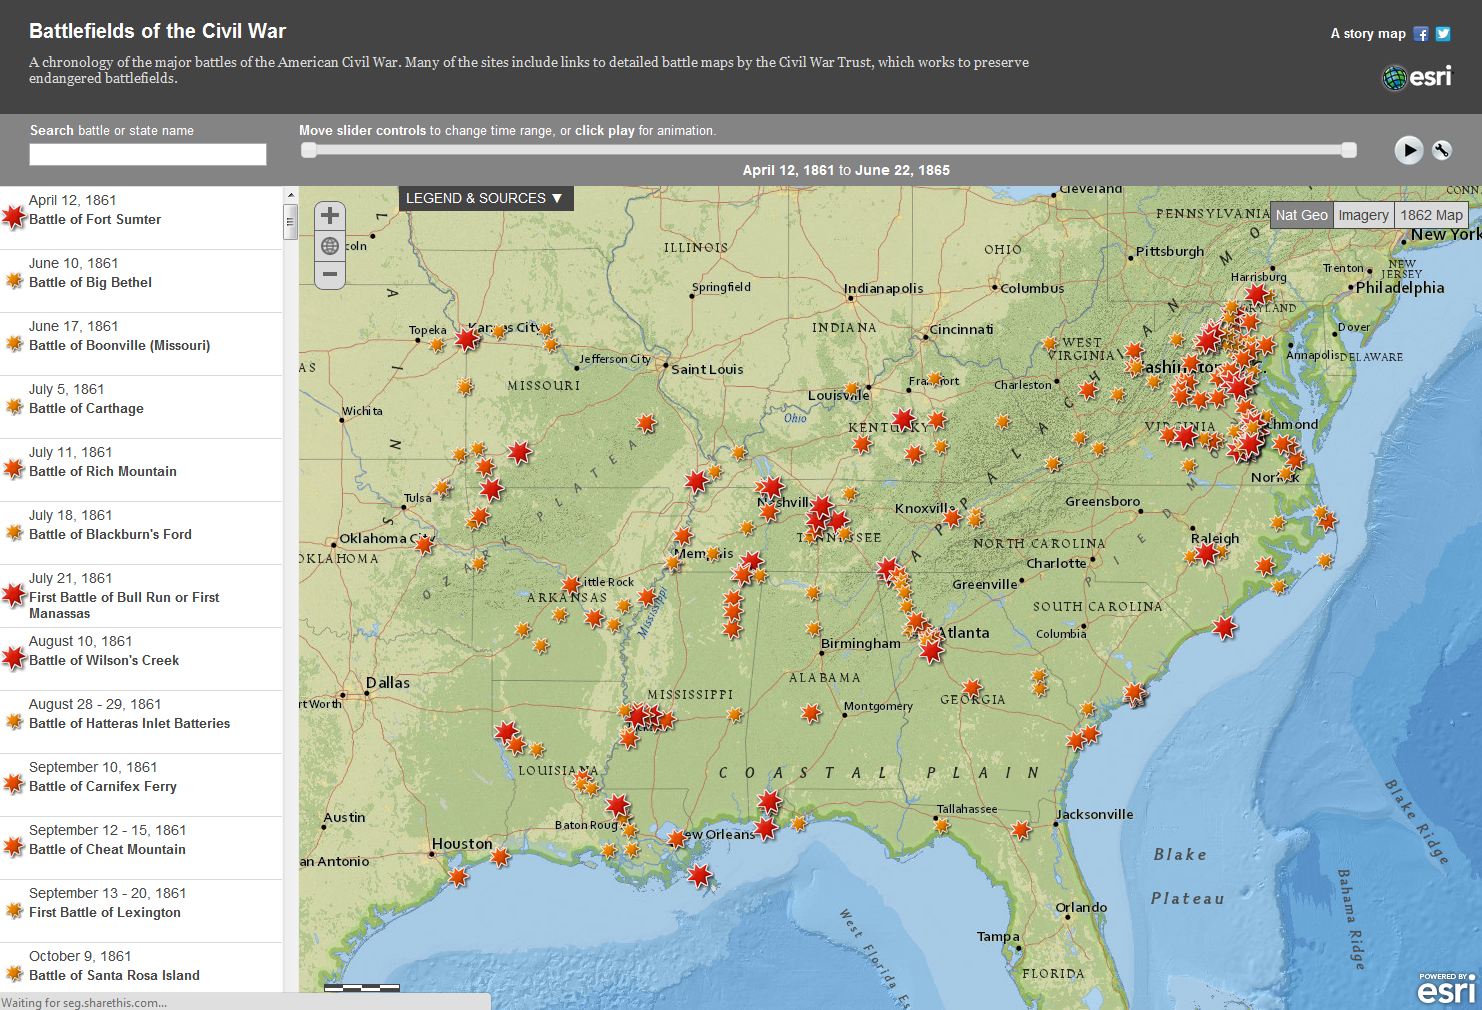
The web map was ready for its debut. But it needed a stage and a script with which to express its capabilities. In this case the “stage” is a JavaScript app that performs nicely in both browsers and tablets. We had already developed a “playlist” format that we had used in a story map about American watersheds. JavaScript virtuoso Stephen Sylvia adapted this format to enable a chronological listing of the battles. He also incorporated and refined a search capability that lets users find battles and type in state names, which neatly excludes all battles except those within the featured state.
The trickiest part was perfecting the timeline. Stephen made repeated adjustments, finally achieving an array of options including dragging pointers to manually set date ranges, playing and pausing an animation, and enabling users to change animation settings. The app also lets users choose among basemaps: The default National Geographic map, satellite imagery, and David Rumsey’s 1862 map. A dropdown box displays the map legend and links to sources.
The resulting story map gives users several ways to explore the map: searching, browsing, panning and zooming, adjusting time, and switching theme. It’s interesting to move the time slider or play the animation to reveal patterns of conflict, especially the line of battles along Sherman’s route to Atlanta. It’s also interesting to choose the imagery option, zoom in for a close-up view, and click from battle to battle. You’ll quickly see why the Civil War Trust faces an ongoing challenge: Many of the battle sites are within or near subdivisions and strip malls.
insider
