There’s lots of unique and interesting ways to use Story Maps—some obvious, and some not so obvious
Story Maps let you combine authoritative maps with text, images, and multimedia content, and make it easy to harness the power of maps and geography to tell your story. Story Maps can be used for a wide variety of purposes; for advocacy and outreach, virtual tours, travelogues, delivering public information, and many more. You can browse a large collection of examples by visiting the Story Maps Gallery.
Many of the ways you can use Story Maps are obvious, but others aren’t. Here’s a list of nine things you can do with Story Maps that you might not have thought of before. Click the image to open the Story Map.
Annual Reports
Annual reports deliver a comprehensive summary of a business or organization’s activities throughout the preceding year. Annual reports can cover a wide variety of activities, lots of different media, and can be enhanced with maps. This example from the Pennsylvania Horticultural Society uses Story Map Journal. If you listen closely when you open it, you’ll find it also includes audio.

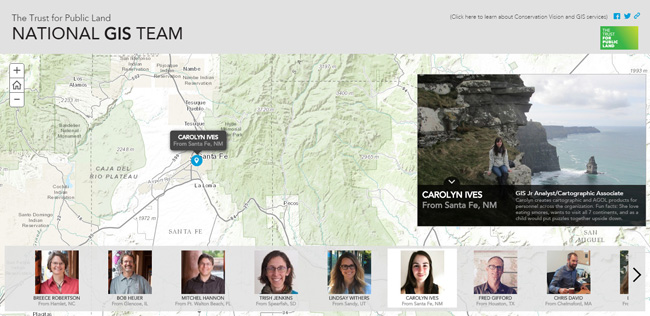
Introducing your staff or yourself
Introducing your staff to customers or the public lets them know who you are, and provides way to showcase the expertise and personality of your company. The example below introduces The Trust for Public Land’s national GIS team. You’ll learn about each member—where they are from, what they like to do, and their roles and responsibilities. This example uses Story Map Tour.
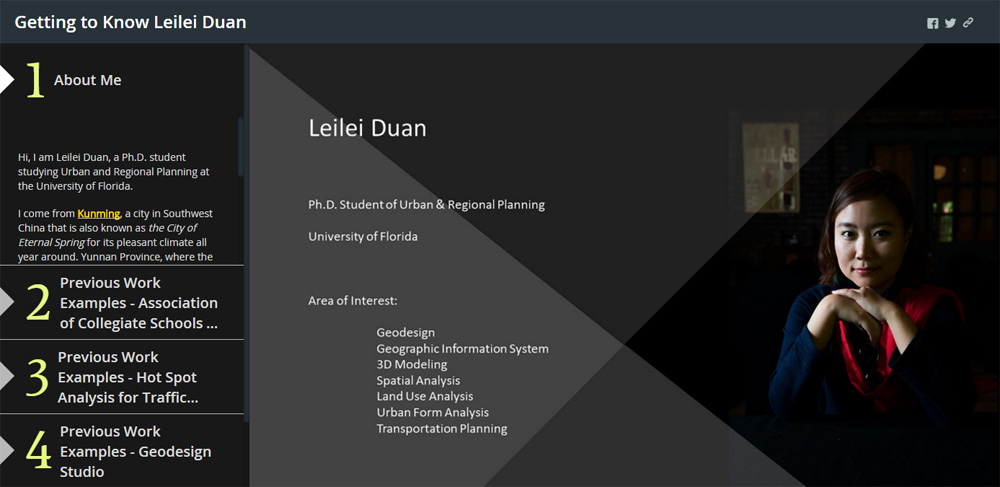
You can introduce yourself using a Story Map as an interactive resume. This example from Leilei Duan uses Story Map Series (with the side accordion layout), providing a compelling way for prospective employers to not only learn more about Leilei, but also see her GIS work through interactive maps.
Promoting and marketing events
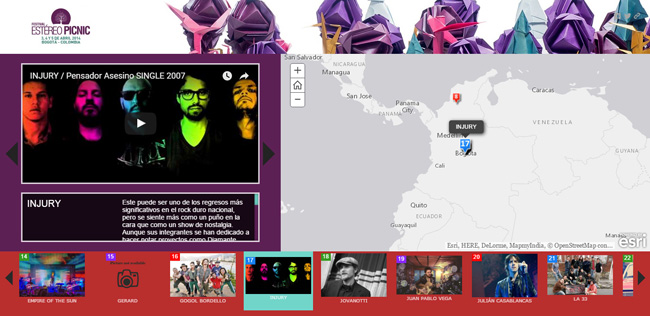
You’re staging an event, and want to attract and entice attendees. A Story Map delivers an opportunity to not only reach your audience, but also delivers an interactive way to explore event venues or attractions. As a bonus, the story map can be embedded directly into the event website.
This Story Map Tour highlights musicians performing at the Estereo Picnic in Bogotá, Columbia, and includes a music video of each artist.
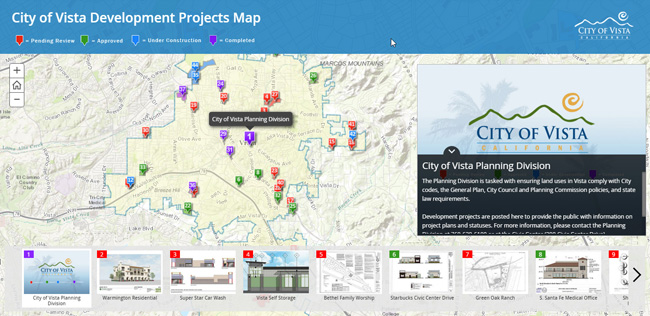
Project or business portfolios
A Story Map can be used to showcase your business activities, or projects your organization has completed. The City of Vista uses a Story Map Tour to highlight their planned, current, and proposed development projects.
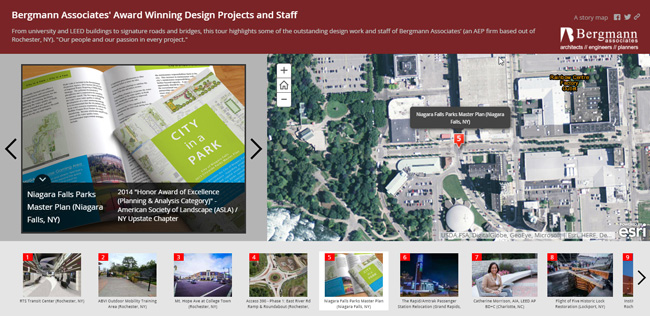
Not just for government organizations, private industry can also benefit from Story Maps. This tour is used by Bergmann Associates to showcase their portfolio of architectural, engineering, and planning projects.
Teaching or instruction
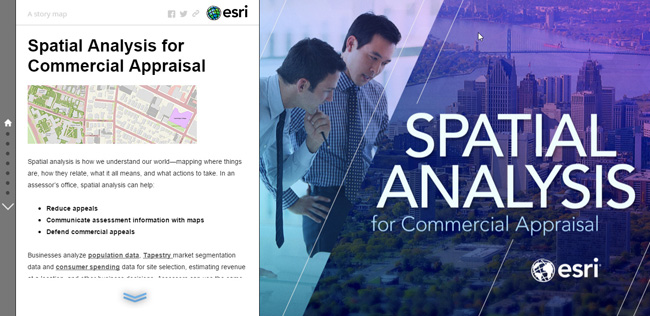
This Story Map Journal explains how spatial analysis can be applied to commercial appraisal. Story Map Journal is a great choice when you have lots of maps and media. Topics can be organized into sections and viewed sequentially.
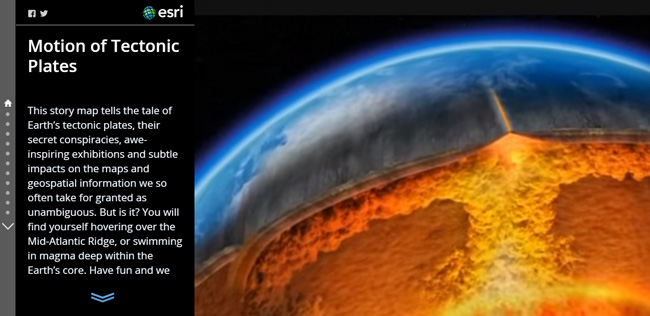
The example below uses a combination of videos, images, and interactive maps to explain the motion of the earth’s tectonic plates. The opening video is especially interesting.
See more examples of instructional Story Maps in the Gallery.
Public relations
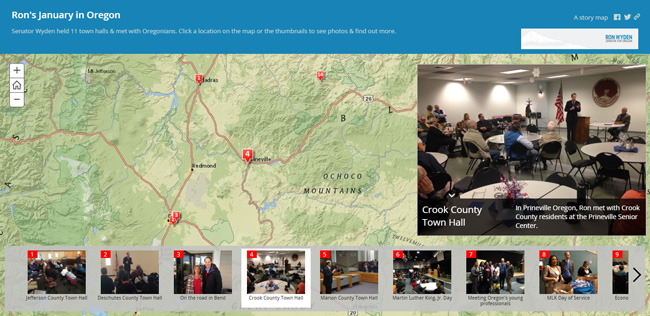
Whether you’re an elected official keeping your constituency informed of your activities, or a charitable organization rallying supporters for a cause, Story Maps can be an effective way to reach your audience. The first example uses a Story Map Tour to highlight Oregon Senator Ron Wyden’s town halls and meetings.
This next example educates and informs the viewer of the devastating effects of ivory poaching on elephants, delivering a call to action and generating interest and empathy to support a cause.

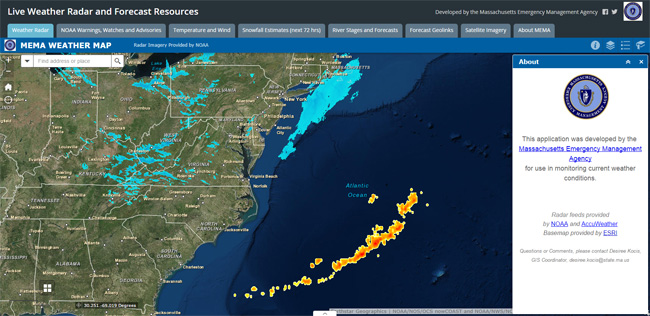
Dashboards
Dashboards provide a heads-up display of information, often including live feeds to show current events or conditions. The Massachusetts Emergency Management Agency (MEMA) uses a Story Map Series (tabbed layout) to show current weather conditions along with other dynamic data at their Emergency Operations Center (EOC).
The photo below shows the MEMA EOC with the Story Map displayed on the wall monitor at left front, and also on the laptop in the right foreground (photo courtesy Desiree L. Kocis, MEMA).

The Story Map used in the EOC, shown below, uses live feeds from NOAA and other sources from the Living Atlas, along with weather feeds and forecasts provided by Accuweather.
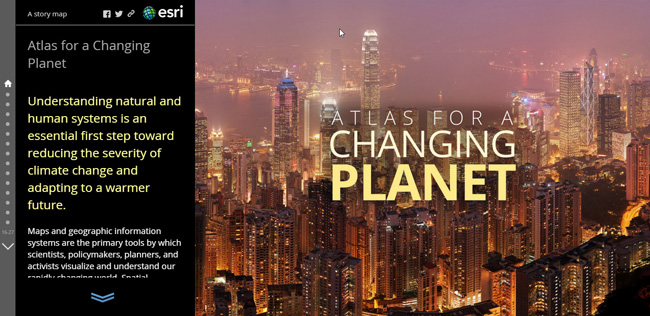
An atlas
The traditional atlas is a collection of maps bound in a book. But a Story Map atlas rejuvenates the concept of an atlas by enabling the use of dynamic, rather than static, maps, and providing a framework to enhance the atlas with rich text and interactive media.
The Atlas for a Changing Planet, shown below, uses interactive maps, graphs, and media to document our changing planet. It embeds other Story Maps within it, and also includes time-enabled maps that demonstrate change over time.
Briefings and presentations
Especially when you want to use live maps during a briefing or presentation, a Story Map is a unique and compelling way to make your point without having to switch modes from PowerPoint to a map or app. You can even export your PowerPoint slides and use them in your Story Map.
The screen capture below shows a Story Map Series displaying a PowerPoint slide used in a presentation during the Esri 2015 User Conference. The Story Map Series bulleted layout was specifically adapted to support presentations. Click the image to view the video of how the Story Map was used during the User Conference plenary.
See Story Map presentations instead of PowerPoint for more details.
Summary
There’s lots of unique and interesting ways to use Story Maps, some obvious, and some not so obvious. But with a little creative thinking you’ll discover many ways to apply Story Maps for your presentation, communication, or visualization needs. This post highlights nine, what do you do with Story Maps?
(Thanks to contributions by Rupert Essinger)
insider
