The electromagnetic spectrum
In the early history of powered aircraft, aerial photographs—pictures of the earth from above—began to be found useful for military and scientific applications. Quite quickly, imaging professionals and scientists realized that it was possible to detect beyond what is visible to the unassisted human eye. Deeper and richer information could be revealed by detecting waveforms from beyond the rainbow of visible light, into the invisible. As it turns out, these hard-to-detect realms of the spectrum offered some of the most meaningful insights. Hidden in these signals were previously unknown facts about Earth that have enabled us to understand our world far more effectively than had been possible.
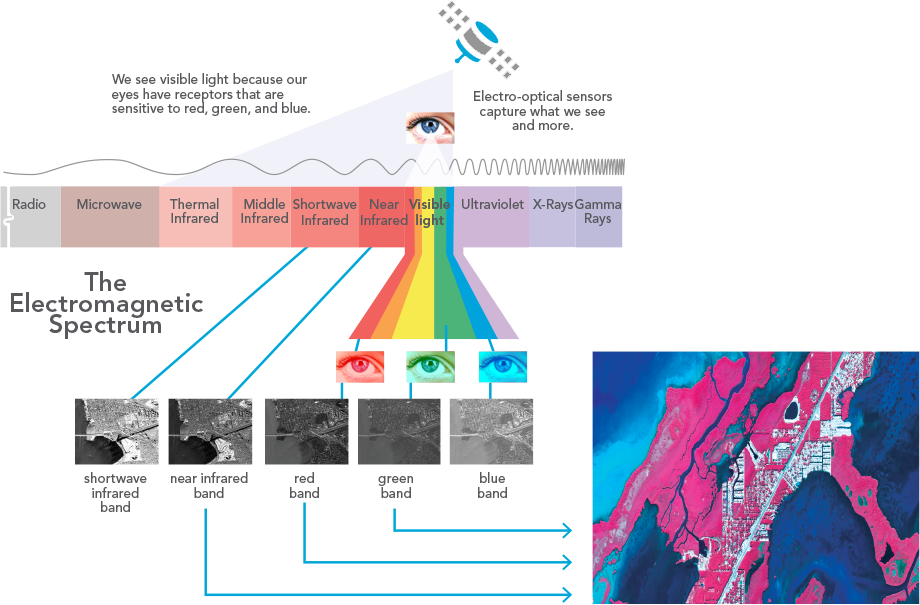
One of the most extraordinary types of imagery collected by remote sensing is multispectral imagery. Each image is composed of data from a series of onboard sensors that collect small slices (or bands) across the electromagnetic spectrum. The table below shows the complete list of wavelengths (expressed as bands) that are collected by the Landsat 8 imagery according to what they capture. The images below are examples of what you “see” by combining different bands into red, green, and blue electronic displays or hard-copy prints.

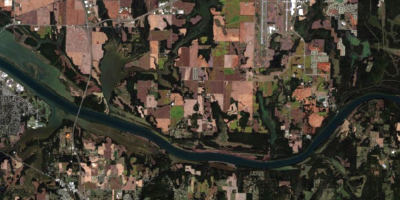
The Natural Color (bands 4, 3, 2) combination of red, green, and blue is well suited for broad-based analysis of both terrestrial and underwater features and for urban studies.
Color infrared
Color infrared photography, often called false color photography because it renders the scene in colors other than those normally seen by the human eye, is widely used for interpretation of natural resources.
Land and water interface
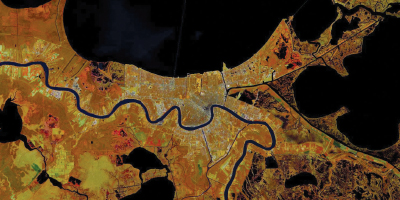
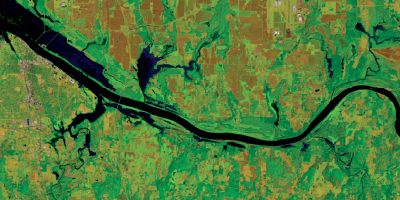
Landsat GLS Land and Water Boundary (bands 4, 5, 3) emphasizes the edges between land and water.
Vegetation analysis
This 6, 5, 4 band combination shows irrigated vegetation as bright green. Soils appear as tan, brown, and mauve.
Multispectral band combinations
Multispectral imagery measures different ranges of frequencies across the electromagnetic spectrum. One way to think of these different frequencies is as colors, where some colors are not directly visible to human eyes. These frequency ranges are called bands. Different image sensors measure different band combinations. The longest-running and perhaps most well-known multispectral imaging program has been Landsat, which began Earth image collection in the 1970s. By assigning data from three bands of the sensor to the red, green, and blue channels of an electronic display (or printer for a hard copy), color visualizations are created. Here are some examples of various alternate band combinations and their applications.
Panchromatic

Panchromatic imagery, commonly known as pan, is typically recorded at a higher resolution than the multispectral bands on any given satellite. It remains a critical source for many GIS applications as a reference for basic interpretation and analysis. Pan is often combined with other bands through a process called pansharpening to generate higher-resolution scenes.
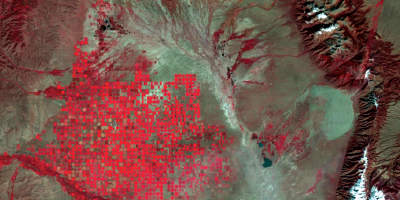
Agriculture
In the Agricultural band (combination 5, 4, 1) vigorous vegetation appears bright green, healthy vegetation appears as a darker green, and stressed vegetation appears dull green.
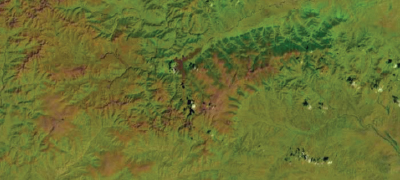
Moisture index

The Normalized Difference Moisture Index (NDMI) estimates moisture levels in vegetation where wetlands and vegetation with high moisture appear as blue growing to dark blue for higher moisture levels, and drier areas appear as yellow to brown shades. Image analysts often apply a formula to combine the selected multispectral bands to calculate various indexes.
—–
This post is excerpted from The ArcGIS Imagery Book: New View, New Vision. Imagery is suddenly a big deal, and those who are adept at finding it, analyzing it, and understanding what it actually means are going to be in demand in the years ahead. The purpose of this book is to help everyone from GIS professionals to app developers, and web designers to virtually anyone how to become smarter, more skillful, and more powerful appliers of image data. The book is available through Amazon.com and other booksellers, and is also available at http://www.TheArcGISImageryBook.com for free.