Asking questions and developing answers using a common vocabulary leads to better decision making.
As discussed in a previous post, spatial analysis can be viewed as a kind of common language used across an organization. It starts with a set of questions, such as Where are things located in the world?, What is nearby?, and How are things connected?, and then sets about answering those questions by leveraging the power of GIS.
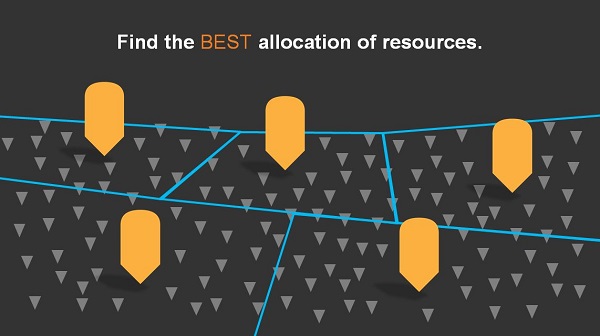
Imagine a bank with a number of different branch locations, along with locations of all the customers they service in a specific geographic region. The bank can use spatial analysis to better balance its service to these customers based on drive time analysis and delineate geographic areas with similar capacity.

Next, the bank could use spatial aggregation to count and summarize the number of customers within each service area. These service areas can be dynamically symbolized based on any of the data variables associated with the customers or to represent number of customers, total salary of staff, total sales, total cost of operation, and other key performance indicators. This type of mapping allows analysts and decision-makers to easily compare adjacent or even distant features with each other to see how different variables are trending.
It’s also very easy to see where change is occurring or to discover anomalies. Further analysis might reveal new patterns in buying behavior or changes in the customer base. Spatial analysis might uncover obstacles, such as road closures, or changes in infrastructure, such as the extension of light rail through a territory that is causing customers to use other branches more frequently.

This type of information helps management make tough decisions while maintain the high level of service their customers are seeking. It might even result in a store closure and the redistribution of resources based on customer preferences and access to services.
Banking on Spatial Analysis
This year alone, Bank of America made nearly 3,000 site decisions, and every single one involved spatial analysis.
Bank of America tracks every single transaction by customer, location, time, and channel, and then stores the information for 60 months of history—more than 20 terabytes of data. They also maintain information on the capacity of each branch or ATM, any peak time issues, costs of each location, its total revenues, annual sales, new customer, and the addition or removal of assets (such as new ATMs).

Every day, Bank of America’s Senior Vice President for Retail Distribution and his boss study the same maps—looking for trends and anomalies that are impacting the cost-effectiveness of the operation.
Using maps, they can quickly zero in on problems and opportunities. Decisions that used to take a week of analysis now take less than a day.
Bank of America branches now average a million more dollars in annual profit compared other banks. They serve more than twice as many households. And they have a 50 percent higher return per employee.
The bottom line: Mr. Voorhees and his boss use the language of spatial analysis to make sense of the massive amount of data pouring into their systems every day so that they can make better decisions.
Cutting through the Noise
Imagine that your assets aren’t stationary but are mobile, such as a fleet of delivery trucks. Every day, problems occur—vehicles break down, deliveries are delayed, and drivers get lost.
Tracking where all those problems occur and understanding why they occur can help improve the system and provide actionable information for avoiding those situations in the future.

Spatial analysis helps you cut through the noise of data to help you understand spatial trends.
For example, you could map where problems occur and see if there is a pattern to them. A simple heat map may be enough to help you pinpoint important patterns. If necessary, you could run hot-spot analysis to statistically validate whether or not those concentrations were significant or possibly related to some other variable. Either way, you move beyond simply putting dots on a map so that you can get a much clearer picture of what’s going on.
Then you could compare your analyses for each type of problem by designated time periods.

These comparative maps allow you to analyze and further understand spatial variations. You can visualize the highs and lows and their distribution across space.
These comparative analyses can be accomplished using historical, current, and even real-time analytical maps. As a result, you can dial into where real problems are occurring with great frequency and compare that information over time.
Speaking the common language of spatial analysis, organizations can ask tough questions and leverage the power of geography to make better decisions. And that’s the real power of GIS.
insider
