For many Americans, the rise in student loan debt means slowing economic recovery, delaying lifestage changes, and even postponing retirement.
Usually considered an issue that impacts only recent college graduates, new studies find that student loan debt is growing among pre-retirees and even those who have already retired. The 2013 Survey of Consumer Finances (SCF) notes that the rise in student loan debt is pervasive and affects nearly every age group. Families with education loans increased between 2010 and 2013, continuing the long-term trend of rising education debt. Forty-five percent of all American families have outstanding student loans, up from 33 percent in 2007. Between 2001 and 2013, education debt increased from 22.4 percent to 38.8 percent for young families—a household headed by someone younger than age 40.
How is this situation impacting the overall US economy?
Delaying Growth
Because of their student loans, many younger people are delaying home ownership, marriage, and having kids until their finances improve. Because most of this group aren’t establishing their own households now, growth of the broader economy remains sluggish. Many aren’t buying houses, or items such as furnishings, baby/children’s products, or home improvement/construction materials.
Phyllis Korkki notes in The New York Times that people with student loan debt might not finance their own small business. In a 2011 study, Jesse Rothstein of the University of California, Berkeley, says that people carrying student loan debt may be less likely to take low-paying public service jobs. Spending years paying off student loans will also adversely affect their ability to save for retirement. According to the Center for Retirement Research at Boston College, 62 percent of workers age 30 to 39 are projected to have insufficient resources in retirement.
Older Americans Share Student Debt Load
At the other end of the spectrum are pre-retirees or retirees who are also struggling with student loan debt. An article from TIAA CREF says that some older Americans are now assuming student loan debt. They may prefer to take out loans instead of dipping into their savings to pay for classes. They are either updating their own education to get a better job or helping their children avoid education debt. The Federal Reserve Bank of New York states that student loan debt held by people age 60 and older totaled $43 billion at the end of 2012, with an average debt level of $19,521 per person, up from a total of $16 billion at the end of 2007, or $14,930 per person.
Nearly 140,000 retirees have been shocked that loan repayments are being deducted from their Social Security benefits, just when they may be living on fixed incomes. The General Accounting Office states that more than 80 percent of these outstanding balances are from seniors who financed their own education; the remaining 18 percent was attributed to loans that financed the education of a spouse, child, or grandchild.
In December, 2014, the Family Financial Trade-offs Survey from T. Rowe Price questioned 2,000 parents with college-age children and found that 53 percent of the respondents would rather use their retirement savings, delay retirement, or take a second job so their kids wouldn’t incur education debt. Perhaps they remember their own repayment experiences and want to help their children avoid this situation. Forty-four percent also noted that paying off their loans had affected their ability to save for retirement.
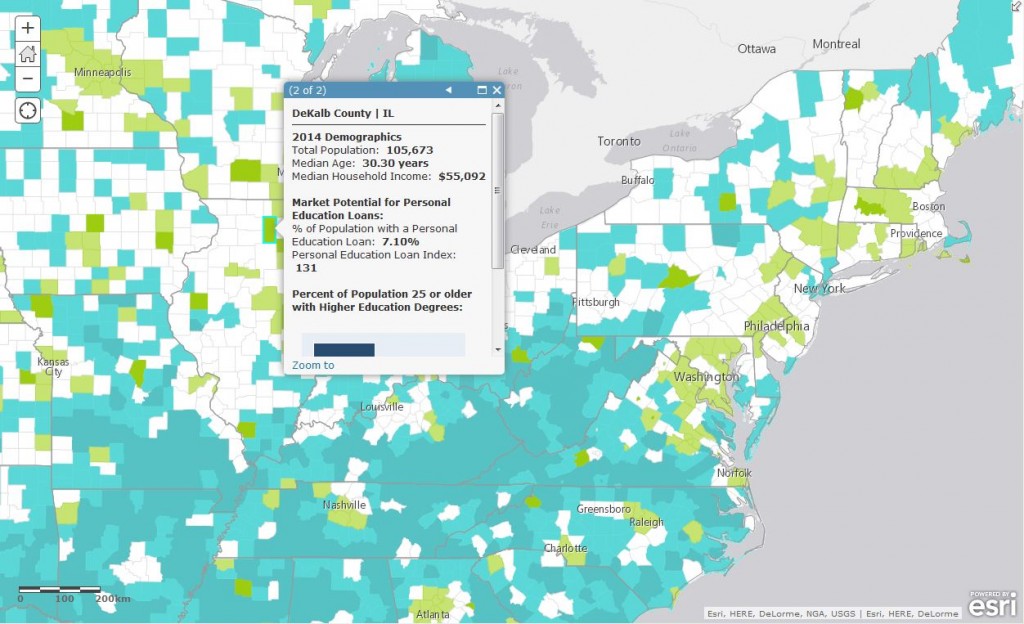
Mapping Student Loan Debt

It’s not surprising that Franklin County, in the Columbus area of Ohio and home to The Ohio State University, tops the list of people carrying a student loan. The MPI of 199 for ZIP Code 43202 means that people here are 99 percent more likely to have a student loan compared to the US average. The area’s diverse economy is based on education, government, insurance, banking, fashion, defense, aviation, food, clothes, logistics, steel, energy, medical research, health care, hospitality, retail, and technology.
Conversely, with an MPI of 27, demand for a student loan in ZIP code 90201, the Bell Gardens area of Los Angeles County, is 73 percent lower than the US average. According to California Watch, Bell Gardens has the highest percentage of residents who have not completed ninth grade (44.9%) of any California city. Only 1.3 percent hold a graduate degree, while 11.3 percent have no degree. Livability.com notes that the general medical and surgical hospitals industry provides employment to 3.1 percent of all workers in Bell Gardens. Other leading employment opportunities include movie and video production, temp agencies, and physicians’ offices.
Dealing with Debt
Until the recent grads and seniors carrying student loans can figure out how to pay off their debt and be able to spend money elsewhere, many Americans are likely to delay lifestyle changes and the economy will probably continue to struggle toward a strong recovery.
—–
Esri Demographics includes the Market Potential database along with US and global data for demographics and spending. Tapestry Segmentation data provides detailed demographic, lifestyle, and lifestage information about every US neighborhood.
