Want to be “in” the cool club? Use hexagons to visualize your data.
Over the last few years we’ve seen more and more maps that use hexagons. They have become “cool”. Why is that? Well, hexagons and other regularly shaped features allow you to normalize geography for thematic mapping rather than be constrained to using irregular shaped polygons created from a political process (for example, county boundaries, census tracts, zip codes, etc.). And this is VERY useful because of the massive disparity in some of these shapes.
For instance, if you create a thematic map using US counties, the county where I live disproportionately stands out as it the largest county in the US and is 20,105 square miles (52,070 km2), or slightly larger than the states of New Jersey, Connecticut, Delaware, and Rhode Island combined. Using appropriately sized regularly spaced shapes helps solve this disparity of perception.
But why hexagons?
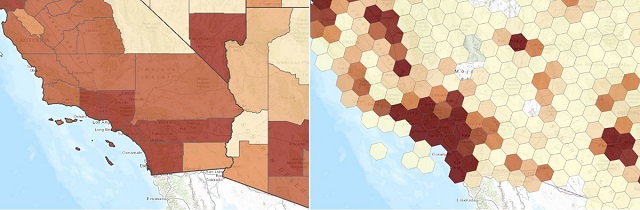
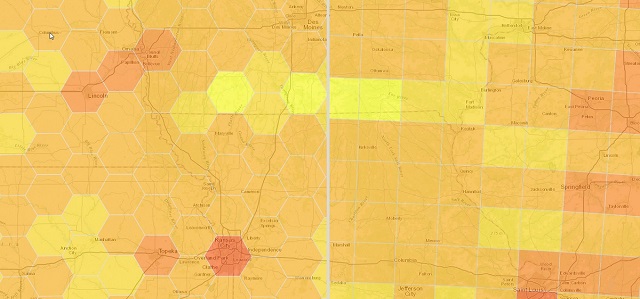
Simply put, hexagons are good for visualization because they nest together perfectly and look good. Rectangles are also a good way to show data, and we do it all the time with rasters and imagery data, but the linear patterns of the rectangles are very apparent when zoomed far enough in to see them. The linear patterns in the hexagons are not as apparent and the shapes “softer”, making them more attractive when you are able to see the shape outline. (Note: if you are zoomed out to a small scale, rectangles and hexagons look the same, so the scale at which the data will be used is important).
How do you assign data to hexagons?
Assigning data to hexagons is pretty easy. You just need more detailed data than the scale of your hexagons and then you aggregate that data into your hexagons. You simply overlay your source data (for example, a set of points representing bridge locations) and a layer of hexagons, and then summarize the values that intersect your hexagons. This is very easy for point data, as you take all the points within a single hexagon and specify how you want to aggregate each field in the point data (maximum, minimum, average, count, etc.). If your data is represented as lines or polygons you can also overlay the data, but you should be aware that you are introducing some interpolated data into your results. (Use the “Summarize within” analysis tool in ArcGIS Desktop or ArcGIS Online to aggregate the data.)
Depending on the extent or your source data, you may want to do this aggregation at a couple of different scales. Then you can create multi-scale hexagons that turn on as you zoom in or out on the map, giving your end-users a more dynamic experience. They only see data appropriate at the given scale and never struggle to discern the data.
Obscuring the source.
An interesting aspect of this data aggregation is that you can use it to obscure the source of the data for privacy reasons. For instance, if you have a list of conference attendees and you want to show a map of where the attendees came from, you probably don’t want to show their actual location due to privacy issues. And you may not want to use zip codes for similar reasons. But you could use multi-scale hexagons to show an approximate area of the people and even filter the results so you only show hexagons that have more than 10 people.

What about analysis?
Because hexagons do not follow the tightly controlled row and column notation (unlike raster/imagery data), doing overlay or other analysis with hexagons is a bit more difficult. You of course can filter/select the data easily (the benefits of vector data) and easily symbolize and normalize the data using many attributes and deriving new attributes. But if you are trying to calculate terrain, interpolate information, or derive trends, traditional vector or raster analysis is a better way to go.
Where do I get hexagon shapes to use?
You have a couple of choices: you can use existing hexagons, or create your own. For existing hexagon data, search in ArcGIS Online on the keyword ‘hexagon’ to find some data you can just copy and use (links are also provided at the end of this post). If you don’t find data of the scale you want, you can easily create your own; this blog post provides the script and directions. In fact, there are several Esri blog posts about using hexagons that you may find useful, including Using a binning technique for point-based multiscale web maps and A new tool for creating sampling hexagons.
Know your projection.
I want to note an important aspect to consider when using or making your hexagons: the projection/coordinate system is very important. Because you are normalizing the features, you need to make sure you use hexagons that are based on an equal area projection (or spheroid based radians) or you can skew the visual results. If you end up re-projecting your data, then bear in mind your hexagons will be distorted in terms of their shape and apparent size but because of their original equal area property they will still be equivalent for analytical purposes.
Are hexagons a new idea?
No. The use of hexagons in mapping and in ecological modeling goes back many years. But until the advent of modern computer-based cartography, hexagon maps were extremely labor intensive produce. It should be noted that just like some people are very passionate about rasters/imagery or parcels, others are very passionate about hexagons.
Following are some resources and examples that will help you use hexagons to visualize your data:
Blogs posts:
- Using a binning technique for point-based multiscale web maps
- A new tool for creating sampling hexagons
- 2D Beehive Tool a.k.a. Create Hexagons Tool
Apps:
- App showing comparison of hexagons and rectangles
- App showing the density of bridges in the Continental US using hexagons
Hexagon data:
- Contiguous US Albers Equal Area Hexagons
- Scripts to create hexagons
UPDATE: ArcGIS Online now includes ready-to-use Hexagon Data – making this process and visualization much easier. See Creating thematic maps with hexagons in ArcGIS Online for more information.
